Note
Click here to download the full example code or to run this example in your browser via Binder
Density Plot Example
This example looks at how to plot 2d density plots. The Plotter().plot_density function can be
used to plot any number of StateMutableSequence objects. StateMutableSequences are just a
container for a number of states, examples include tracks and ground truth paths. The examples
below show how to plot ground truth paths (as they’re easy to generate). The function can be used to
analyse large data sets.
Set the imports and set the start time
from datetime import datetime, timedelta
from matplotlib import animation

from stonesoup.types.groundtruth import GroundTruthPath, GroundTruthState
from stonesoup.models.transition.linear import CombinedLinearGaussianTransitionModel, \
                                               ConstantVelocity
from stonesoup.plotter import Plotter

start_time = datetime.now()
Generate the State Sequences to Plot
In these examples we’re going plot ground-truth as that is the easiest to generate. An simple function has been created to ground truth
def generate_ground_truth_path(initial_state, num_steps=20, motion_model_noise=0.01):

    transition_model = CombinedLinearGaussianTransitionModel(
        [ConstantVelocity(motion_model_noise), ConstantVelocity(motion_model_noise)])

    ground_truth = GroundTruthPath([GroundTruthState(initial_state, timestamp=start_time)])

    for k in range(0, num_steps):
        ground_truth.append(GroundTruthState(
            transition_model.function(ground_truth[k], noise=True,
                                      time_interval=timedelta(seconds=1)),
            timestamp=start_time+timedelta(seconds=k+1)))

    return ground_truth
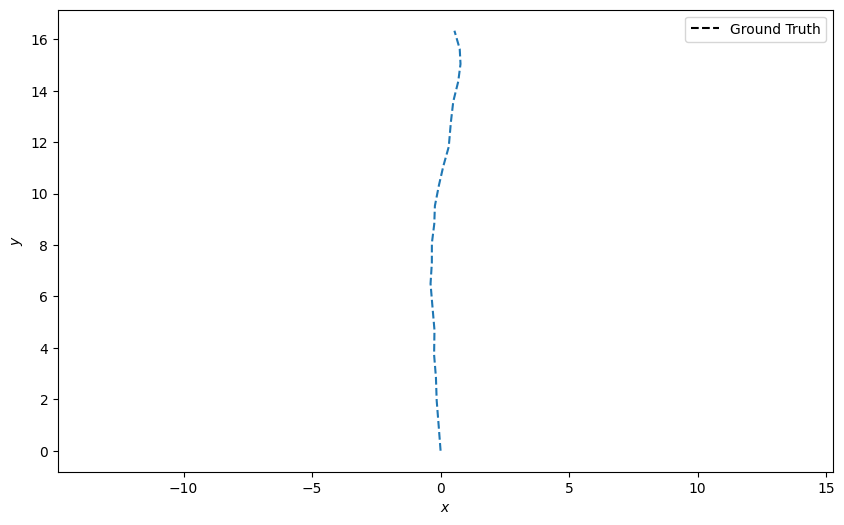
Create one ground truth path starting at the origin (0,0) and plot it
n_time_steps = 20
truth = generate_ground_truth_path(initial_state=[0, 0, 0, 1], num_steps=n_time_steps)

plotter = Plotter()
plotter.plot_ground_truths(truth, [0, 2])
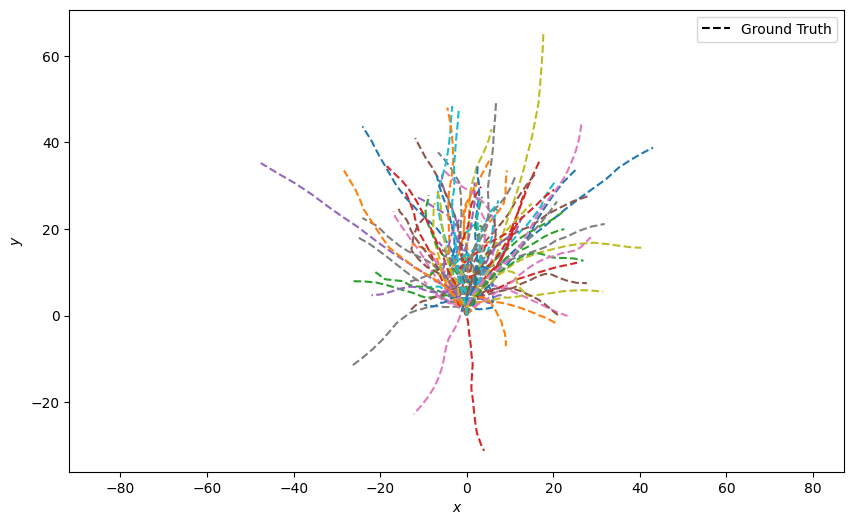
Generate 100 ground truth paths and plot them all at once. This looks quite messy
truths = [generate_ground_truth_path(initial_state=[0, 0, 0, 1],
                                     num_steps=n_time_steps,
                                     motion_model_noise=0.1)
          for _ in range(100)]

plotter = Plotter()
plotter.plot_ground_truths(set(truths), [0, 2])
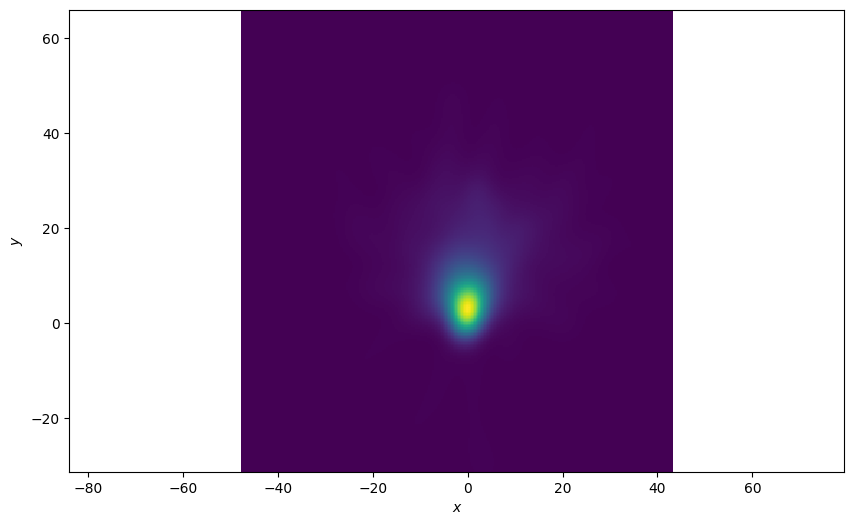
Density Plot of All States
Plot a 2d density plot for all the states in the ground-truth. This is clearer, we can see a clear concentration around the origin where all the tracks start
plotter = Plotter()
plotter.plot_density(truths, index=None)
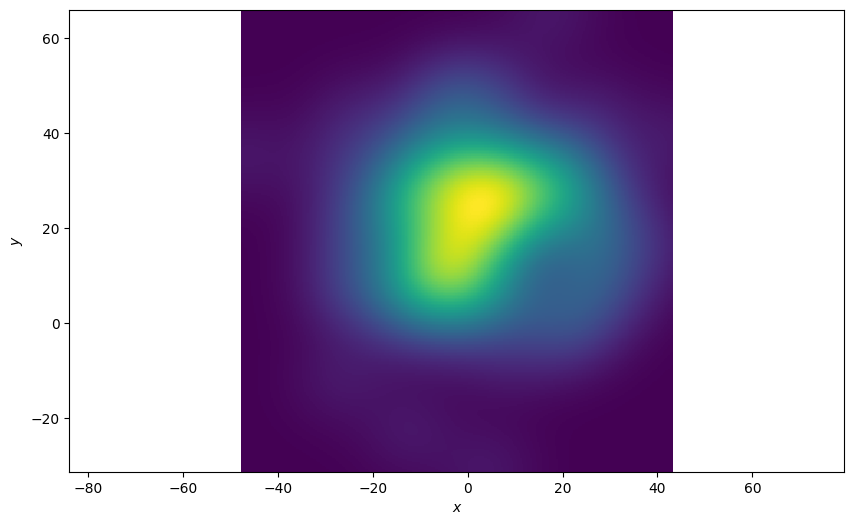
Plot of the Last State of the Ground Truths
The function allows you to pick an index of the state sequence (ground truth in this example) to plot. In this example we’re only interested in the final state of the sequences. An index of ‘-1’ is the last state in the sequence. The resultant plot is much more spread out
plotter = Plotter()
plotter.plot_density(truths, index=-1)
Plot each state over time
Plot the density at each time-step and see how the density plot evolves. Define an animation update function.
def update(i):
    plotter.ax.clear()
    plotter.plot_density(truths, index=i)
    return plotter.ax
Plot the densities over time.
plotter = Plotter()
animation.FuncAnimation(plotter.fig, update, frames=range(1, n_time_steps))
Total running time of the script: ( 0 minutes 20.726 seconds)