Note
Click here to download the full example code or to run this example in your browser via Binder
Metrics Example
This example is going to look at metrics, and how they can be used to assess algorithm performance.
Building a Simple Simulation and Tracker
For simplicity, we are going to quickly build a basic Kalman Tracker, with simple Stone Soup simulators, including clutter. In this case a 2D constant velocity target, with 2D linear measurements of position.
import datetime

import numpy as np
import matplotlib.pyplot as plt

from stonesoup.dataassociator.neighbour import GNNWith2DAssignment
from stonesoup.deleter.error import CovarianceBasedDeleter
from stonesoup.hypothesiser.distance import DistanceHypothesiser
from stonesoup.initiator.simple import MultiMeasurementInitiator
from stonesoup.measures import Mahalanobis
from stonesoup.models.transition.linear import (
    CombinedLinearGaussianTransitionModel, ConstantVelocity)
from stonesoup.models.measurement.linear import LinearGaussian
from stonesoup.predictor.kalman import KalmanPredictor
from stonesoup.simulator.simple import MultiTargetGroundTruthSimulator, SimpleDetectionSimulator
from stonesoup.tracker.simple import MultiTargetTracker
from stonesoup.types.array import StateVector, CovarianceMatrix
from stonesoup.types.state import GaussianState
from stonesoup.updater.kalman import KalmanUpdater

# Models
transition_model = CombinedLinearGaussianTransitionModel(
    [ConstantVelocity(1), ConstantVelocity(1)], seed=1)

measurement_model = LinearGaussian(4, [0, 2], np.diag([0.5, 0.5]), seed=2)

# Simulators
groundtruth_sim = MultiTargetGroundTruthSimulator(
    transition_model=transition_model,
    initial_state=GaussianState(
        StateVector([[0], [0], [0], [0]]),
        CovarianceMatrix(np.diag([1000, 10, 1000, 10]))),
    timestep=datetime.timedelta(seconds=5),
    number_steps=100,
    birth_rate=0.2,
    death_probability=0.05,
    seed=3
)
detection_sim = SimpleDetectionSimulator(
    groundtruth=groundtruth_sim,
    measurement_model=measurement_model,
    meas_range=np.array([[-1, 1], [-1, 1]]) * 5000,  # Area to generate clutter
    detection_probability=0.9,
    clutter_rate=1,
    seed=4
)

# Filter
predictor = KalmanPredictor(transition_model)
updater = KalmanUpdater(measurement_model)

# Data Associator
hypothesiser = DistanceHypothesiser(predictor, updater, Mahalanobis(), missed_distance=3)
data_associator = GNNWith2DAssignment(hypothesiser)

# Initiator & Deleter
deleter = CovarianceBasedDeleter(covar_trace_thresh=1E3)
initiator = MultiMeasurementInitiator(
    GaussianState(np.array([[0], [0], [0], [0]]), np.diag([0, 100, 0, 1000])),
    measurement_model=measurement_model,
    deleter=deleter,
    data_associator=data_associator,
    updater=updater,
    min_points=3,
)

# Tracker
tracker = MultiTargetTracker(
    initiator=initiator,
    deleter=deleter,
    detector=detection_sim,
    data_associator=data_associator,
    updater=updater,
)
Create Metric Generators
Here we are going to create a variety of metrics. First up is some “Basic Metrics”, that simply computes the number of tracks, number to targets and the ratio of tracks to targets. Basic but useful information, that requires no additional properties.
from stonesoup.metricgenerator.basicmetrics import BasicMetrics

basic_generator = BasicMetrics()
Next we’ll create the Optimal SubPattern Assignment (OSPA) metric generator. This metric is calculated at each time step, giving an overall multi-track to multi-groundtruth missed distance. This has two properties: \(p \in [1,\infty]\) for outlier sensitivity and \(c > 1\) for cardinality penalty. 1
from stonesoup.metricgenerator.ospametric import OSPAMetric
from stonesoup.measures import Euclidean

ospa_generator = OSPAMetric(c=10, p=1, measure=Euclidean([0, 2]))
And finally we create some Single Integrated Air Picture (SIAP) metrics. Despite it’s name, this is applicable to tracking in general and not just in relation to an air picture. This is made up of multiple individual metrics. 2
from stonesoup.metricgenerator.tracktotruthmetrics import SIAPMetrics

siap_generator = SIAPMetrics(position_measure=Euclidean((0, 2)),
                             velocity_measure=Euclidean((1, 3)))
The SIAP Metrics requires a way to associate tracks to truth, so we’ll use a Track to Truth associator, which uses Euclidean distance measure by default.
from stonesoup.dataassociator.tracktotrack import TrackToTruth

associator = TrackToTruth(association_threshold=30)
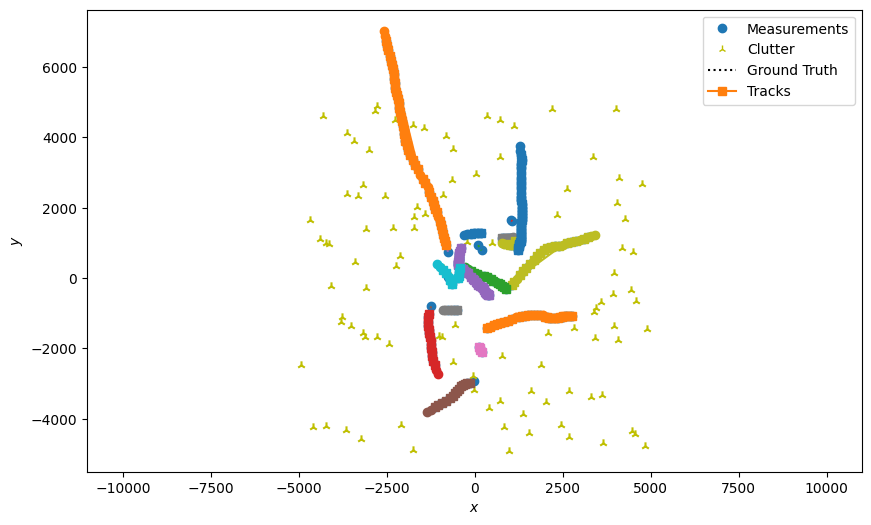
As a final example of a metric, we’ll create a plotting metric, which is a visual way to view the output of our tracker.
from stonesoup.metricgenerator.plotter import TwoDPlotter

plot_generator = TwoDPlotter([0, 2], [0, 2], [0, 2])
Once we’ve created a set of metrics, these are added to a Metric Manager, along with the associator. The associator can be used by multiple metric generators, only being run once as this can be a computationally expensive process; in this case, only SIAP Metrics requires it.
from stonesoup.metricgenerator.manager import SimpleManager

metric_manager = SimpleManager([basic_generator, ospa_generator, siap_generator, plot_generator],
                               associator=associator)
Tracking and Generating Metrics
With this basic tracker built and metrics ready, we’ll now run the tracker, adding the sets of
GroundTruthPath, Detection and Track objects: to the metric
manager.
for time, tracks in tracker:
    metric_manager.add_data(
        groundtruth_sim.groundtruth_paths, tracks, detection_sim.detections,
        overwrite=False,  # Don't overwrite, instead add above as additional data
    )
With the tracker run and data in the metric manager, we’ll now run the generate metrics method. This will also generate the plot, which will be rendered automatically below, which will give a visual overview
plt.rcParams["figure.figsize"] = (10, 8)
metrics = metric_manager.generate_metrics()

So first we’ll loop through the metrics and print out the basic metrics, which simply gives details on number of tracks versus targets.
Number of targets : 17
Number of tracks : 15
Track-to-target ratio : 0.8823529411764706
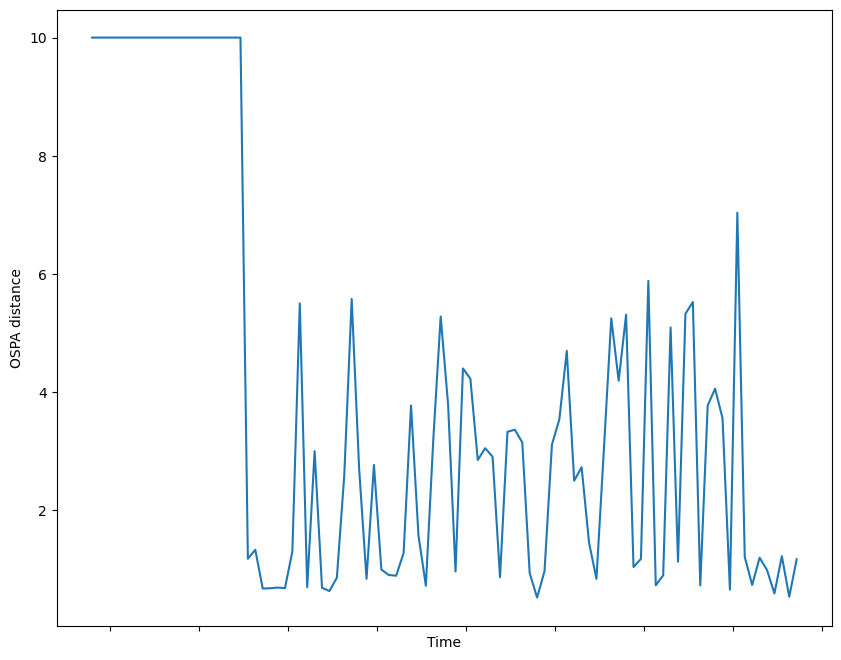
Next we’ll take a look at the OSPA metric, plotting it to show how it varies over time. In this example, targets are created and remove randomly, so expect this to be fairly variable.
ospa_metric = metrics['OSPA distances']

fig = plt.figure()
ax = fig.add_subplot(1, 1, 1)
ax.plot([i.timestamp for i in ospa_metric.value], [i.value for i in ospa_metric.value])
ax.set_ylabel("OSPA distance")
ax.tick_params(labelbottom=False)
_ = ax.set_xlabel("Time")

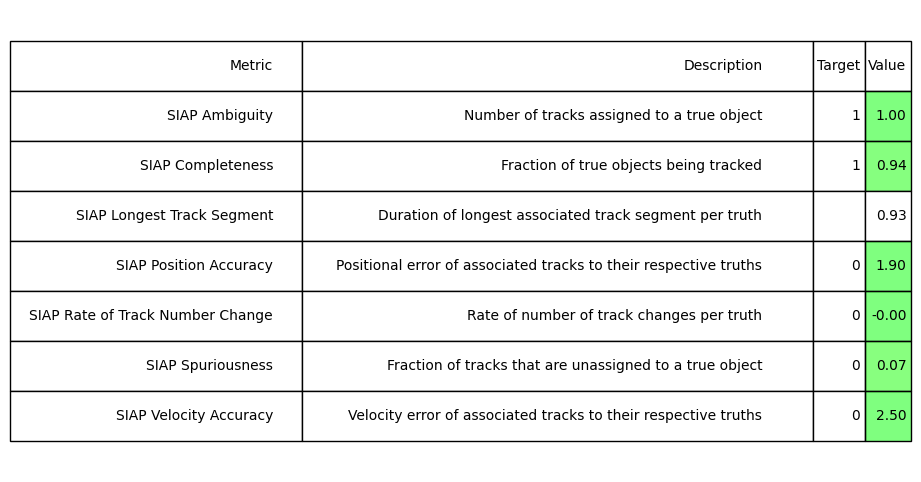
And finally, we’ll look at the SIAP metrics, but to make these easier to visualise and understand we’ll use a special SIAP table generator. This will colour code the results for quick visual indication, as well as provide a description for each metric.
from stonesoup.metricgenerator.metrictables import SIAPTableGenerator

siap_averages = {metrics.get(metric) for metric in metrics
                 if metric.startswith("SIAP") and not metric.endswith(" at times")}
siap_time_based = {metrics.get(metric) for metric in metrics if metric.endswith(' at times')}

_ = SIAPTableGenerator(siap_averages).compute_metric()

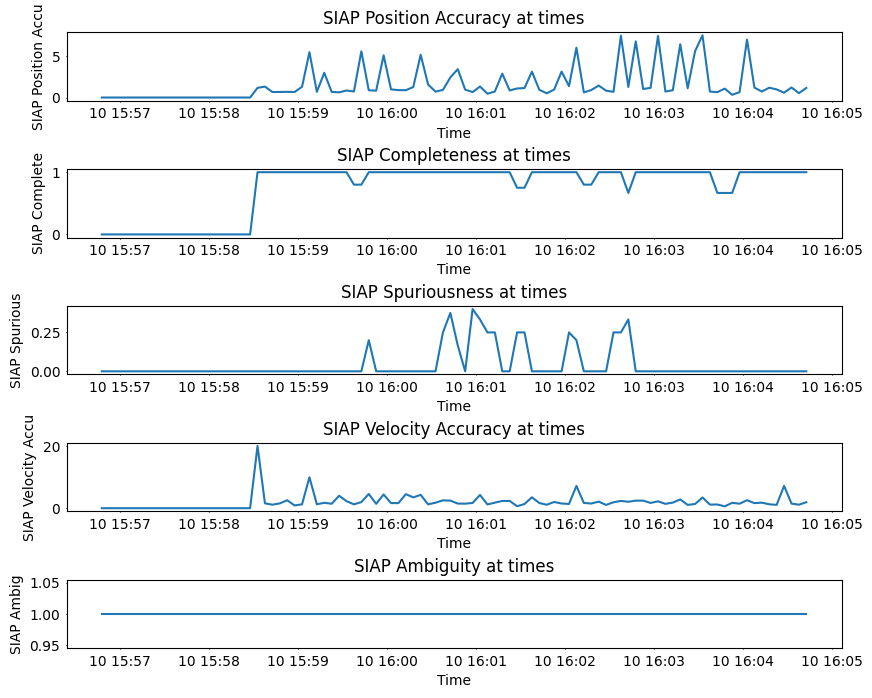
Plotting appropriate SIAP values at each timestamp gives:
fig2, axes = plt.subplots(5)

fig2.subplots_adjust(hspace=1)

t_siaps = siap_time_based

times = metric_manager.list_timestamps()

for siap, axis in zip(t_siaps, axes):
    siap_type = siap.title[:-13]  # remove the ' at timestamp' part
    axis.set(title=siap.title, xlabel='Time', ylabel=siap_type)
    axis.tick_params(length=1)
    axis.plot(times, [t_siap.value for t_siap in siap.value])

Footnotes
- 1
D. Schuhmacher, B. Vo and B. Vo, A Consistent Metric for Performance Evaluation of Multi-Object Filters, IEEE Trans. Signal Processing 2008
- 2
Votruba, Paul & Nisley, Rich & Rothrock, Ron and Zombro, Brett., Single Integrated Air Picture (SIAP) Metrics Implementation, 2001
Total running time of the script: ( 0 minutes 2.825 seconds)