Note
Go to the end to download the full example code or to run this example in your browser via Binder.
Density Plot Example
This example looks at how to plot 2d density plots. The Plotter().plot_density function can be
used to plot any number of StateMutableSequence objects. StateMutableSequences are just a
container for a number of states - examples include tracks and ground truth paths. The examples
below show how to plot ground truth paths (as they’re easy to generate). The function can be used to
analyse large data sets.
Set the imports and set the start time
from datetime import datetime, timedelta
from matplotlib import animation

from stonesoup.types.groundtruth import GroundTruthPath, GroundTruthState
from stonesoup.models.transition.linear import CombinedLinearGaussianTransitionModel, \
                                               ConstantVelocity
from stonesoup.plotter import Plotter

start_time = datetime.now()
Generate the State Sequences to Plot
In this example we will plot ground truth paths due to their ease of creation. The ground truths are created in the following function:
def generate_ground_truth_path(initial_state, num_steps=20, motion_model_noise=0.01):

    transition_model = CombinedLinearGaussianTransitionModel(
        [ConstantVelocity(motion_model_noise), ConstantVelocity(motion_model_noise)])

    ground_truth = GroundTruthPath([GroundTruthState(initial_state, timestamp=start_time)])

    for k in range(0, num_steps):
        ground_truth.append(GroundTruthState(
            transition_model.function(ground_truth[k], noise=True,
                                      time_interval=timedelta(seconds=1)),
            timestamp=start_time+timedelta(seconds=k+1)))

    return ground_truth
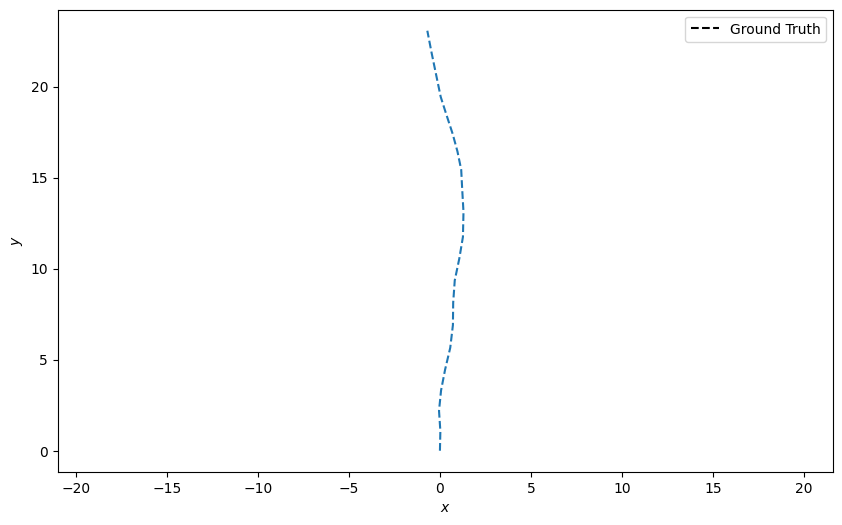
Create one ground truth path starting at the origin (0, 0) and plot it:
n_time_steps = 20
truth = generate_ground_truth_path(initial_state=[0, 0, 0, 1], num_steps=n_time_steps)

plotter = Plotter()
plotter.plot_ground_truths(truth, [0, 2])
[<matplotlib.lines.Line2D object at 0x73d8c4e3d2b0>, <matplotlib.legend.Legend object at 0x73d8c4e3d7f0>]
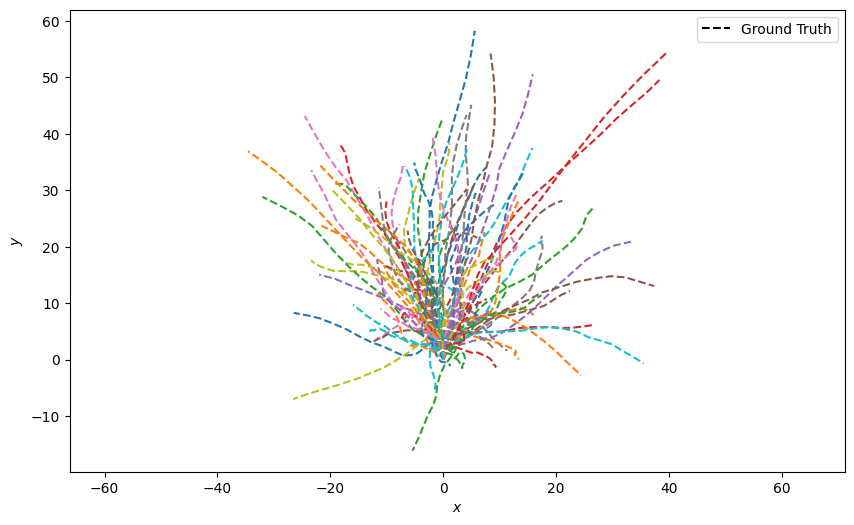
Generate 100 ground truth paths and plot them all at once. This looks quite messy:
truths = [generate_ground_truth_path(initial_state=[0, 0, 0, 1],
                                     num_steps=n_time_steps,
                                     motion_model_noise=0.1)
          for _ in range(100)]

plotter = Plotter()
plotter.plot_ground_truths(set(truths), [0, 2])
[<matplotlib.lines.Line2D object at 0x73d8c7a0dfd0>, <matplotlib.lines.Line2D object at 0x73d8c7a0c6e0>, <matplotlib.lines.Line2D object at 0x73d8c7a0dbe0>, <matplotlib.lines.Line2D object at 0x73d8c7a0ee40>, <matplotlib.lines.Line2D object at 0x73d8c7a0f230>, <matplotlib.lines.Line2D object at 0x73d8c7a0f0e0>, <matplotlib.lines.Line2D object at 0x73d8c7a0c050>, <matplotlib.lines.Line2D object at 0x73d8c7a0e660>, <matplotlib.lines.Line2D object at 0x73d8c7a0f4d0>, <matplotlib.lines.Line2D object at 0x73d8c7a0f380>, <matplotlib.lines.Line2D object at 0x73d8c7a0eba0>, <matplotlib.lines.Line2D object at 0x73d8c7a0c830>, <matplotlib.lines.Line2D object at 0x73d8c7a0d400>, <matplotlib.lines.Line2D object at 0x73d8c7a0c1a0>, <matplotlib.lines.Line2D object at 0x73d8c7a0fe00>, <matplotlib.lines.Line2D object at 0x73d8d8a4ba10>, <matplotlib.lines.Line2D object at 0x73d8d8a4b770>, <matplotlib.lines.Line2D object at 0x73d8d8a48050>, <matplotlib.lines.Line2D object at 0x73d8d8a4bb60>, <matplotlib.lines.Line2D object at 0x73d8d8a48ad0>, <matplotlib.lines.Line2D object at 0x73d8d8a4a270>, <matplotlib.lines.Line2D object at 0x73d8d8a48830>, <matplotlib.lines.Line2D object at 0x73d8d8a48980>, <matplotlib.lines.Line2D object at 0x73d8d8a4bcb0>, <matplotlib.lines.Line2D object at 0x73d8d8a48ec0>, <matplotlib.lines.Line2D object at 0x73d8d8a4acf0>, <matplotlib.lines.Line2D object at 0x73d8d8a48c20>, <matplotlib.lines.Line2D object at 0x73d8d8a49e80>, <matplotlib.lines.Line2D object at 0x73d8d8a4b4d0>, <matplotlib.lines.Line2D object at 0x73d8d8a4b0e0>, <matplotlib.lines.Line2D object at 0x73d8d8a4be00>, <matplotlib.lines.Line2D object at 0x73d8d8a4a7b0>, <matplotlib.lines.Line2D object at 0x73d8d8a48440>, <matplotlib.lines.Line2D object at 0x73d8d8a4a120>, <matplotlib.lines.Line2D object at 0x73d8d8a4aa50>, <matplotlib.lines.Line2D object at 0x73d8d8a481a0>, <matplotlib.lines.Line2D object at 0x73d8d8a482f0>, <matplotlib.lines.Line2D object at 0x73d8d8a4af90>, <matplotlib.lines.Line2D object at 0x73d8d8a4a660>, <matplotlib.lines.Line2D object at 0x73d8d8a4ae40>, <matplotlib.lines.Line2D object at 0x73d8d8a486e0>, <matplotlib.lines.Line2D object at 0x73d8d8a48d70>, <matplotlib.lines.Line2D object at 0x73d8d8a49fd0>, <matplotlib.lines.Line2D object at 0x73d8d8a4b380>, <matplotlib.lines.Line2D object at 0x73d8d8a4a510>, <matplotlib.lines.Line2D object at 0x73d8d8a4a900>, <matplotlib.lines.Line2D object at 0x73d8d8a4b8c0>, <matplotlib.lines.Line2D object at 0x73d8d8a4a3c0>, <matplotlib.lines.Line2D object at 0x73d8d8a49d30>, <matplotlib.lines.Line2D object at 0x73d8d8a4aba0>, <matplotlib.lines.Line2D object at 0x73d8c7e763c0>, <matplotlib.lines.Line2D object at 0x73d8c7e77b60>, <matplotlib.lines.Line2D object at 0x73d8c7e770e0>, <matplotlib.lines.Line2D object at 0x73d8c7e77cb0>, <matplotlib.lines.Line2D object at 0x73d8c7e75010>, <matplotlib.lines.Line2D object at 0x73d8c7e76270>, <matplotlib.lines.Line2D object at 0x73d8c7e756a0>, <matplotlib.lines.Line2D object at 0x73d8c7e741a0>, <matplotlib.lines.Line2D object at 0x73d8c7e74c20>, <matplotlib.lines.Line2D object at 0x73d8c7e77e00>, <matplotlib.lines.Line2D object at 0x73d8c7e74ad0>, <matplotlib.lines.Line2D object at 0x73d8c7e76510>, <matplotlib.lines.Line2D object at 0x73d8c7e75e80>, <matplotlib.lines.Line2D object at 0x73d8c7e76ba0>, <matplotlib.lines.Line2D object at 0x73d8c7e76120>, <matplotlib.lines.Line2D object at 0x73d8c7e74ec0>, <matplotlib.lines.Line2D object at 0x73d8c7e76a50>, <matplotlib.lines.Line2D object at 0x73d8c7e76cf0>, <matplotlib.lines.Line2D object at 0x73d8c7e778c0>, <matplotlib.lines.Line2D object at 0x73d8c7e77620>, <matplotlib.lines.Line2D object at 0x73d8c7e75160>, <matplotlib.lines.Line2D object at 0x73d8c7e77a10>, <matplotlib.lines.Line2D object at 0x73d8c7e75550>, <matplotlib.lines.Line2D object at 0x73d8c7e75400>, <matplotlib.lines.Line2D object at 0x73d8c7e77770>, <matplotlib.lines.Line2D object at 0x73d8c7e767b0>, <matplotlib.lines.Line2D object at 0x73d8c7e76660>, <matplotlib.lines.Line2D object at 0x73d8c7e74d70>, <matplotlib.lines.Line2D object at 0x73d8c7e76e40>, <matplotlib.lines.Line2D object at 0x73d8c7e75fd0>, <matplotlib.lines.Line2D object at 0x73d8c7e76900>, <matplotlib.lines.Line2D object at 0x73d8c5ed0050>, <matplotlib.lines.Line2D object at 0x73d8c5ed01a0>, <matplotlib.lines.Line2D object at 0x73d8c5ed02f0>, <matplotlib.lines.Line2D object at 0x73d8c5ed0440>, <matplotlib.lines.Line2D object at 0x73d8c5ed0590>, <matplotlib.lines.Line2D object at 0x73d8c5ed06e0>, <matplotlib.lines.Line2D object at 0x73d8c5ed0830>, <matplotlib.lines.Line2D object at 0x73d8c5ed0980>, <matplotlib.lines.Line2D object at 0x73d8c5ed0ad0>, <matplotlib.lines.Line2D object at 0x73d8c5ed0c20>, <matplotlib.lines.Line2D object at 0x73d8c5ed0d70>, <matplotlib.lines.Line2D object at 0x73d8c5ed0ec0>, <matplotlib.lines.Line2D object at 0x73d8c5ed1010>, <matplotlib.lines.Line2D object at 0x73d8c5ed1160>, <matplotlib.lines.Line2D object at 0x73d8c5ed12b0>, <matplotlib.lines.Line2D object at 0x73d8c5ed1400>, <matplotlib.lines.Line2D object at 0x73d8c5ed1550>, <matplotlib.lines.Line2D object at 0x73d8c5ed16a0>, <matplotlib.lines.Line2D object at 0x73d8c5ed17f0>, <matplotlib.legend.Legend object at 0x73d8c7a0de80>]
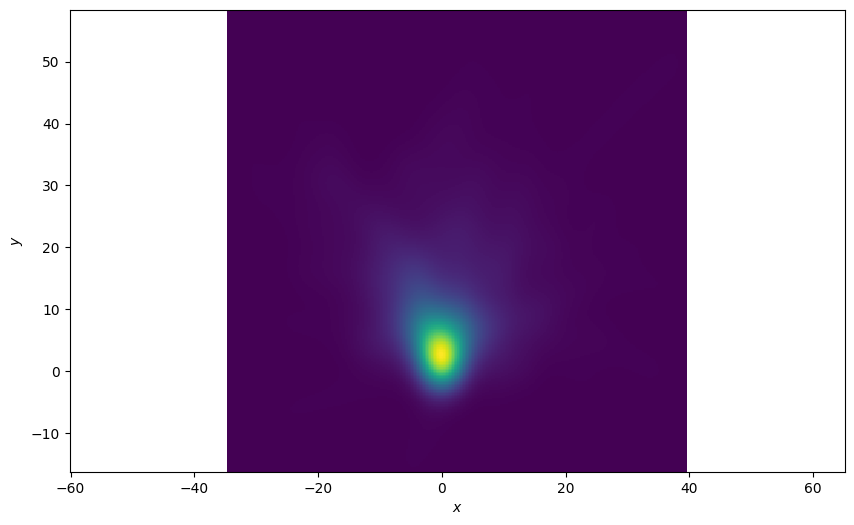
Density Plot of All States
Plot a 2D density plot for all the states in the ground truths. This is a better visualisation because we can see a clear concentration of states around the origin where all the tracks start.
plotter = Plotter()
plotter.plot_density(truths, index=None)
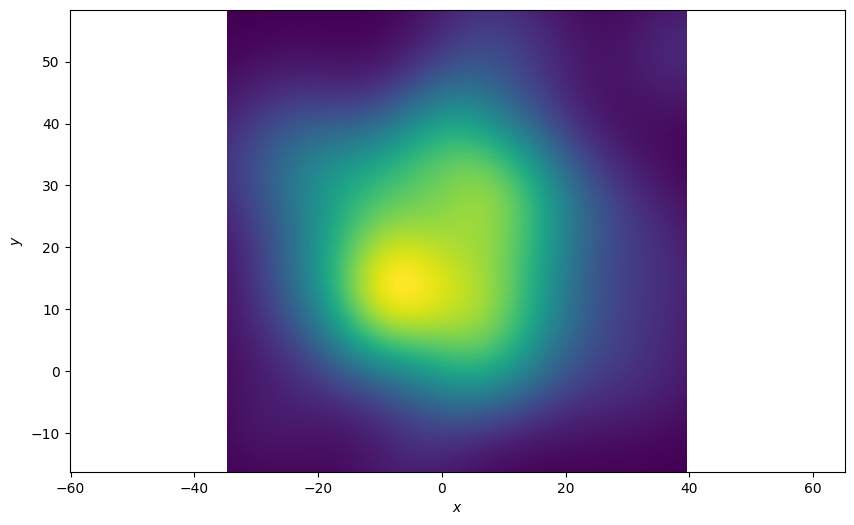
Plot of the Last State of the Ground Truths
The function allows you to pick an index of the state sequence (ground truth in this example) to plot. In this example we’re only interested in the final state of the sequences. An index of ‘-1’ is the last state in the sequence. The resultant plot is much more spread out.
plotter = Plotter()
plotter.plot_density(truths, index=-1)
Plot each state over time
Plot the density at each time-step and see how the density plot evolves. Define an animation update function.
def update(i):
    plotter.ax.clear()
    plotter.plot_density(truths, index=i)
    return plotter.ax
Finally, plot the densities over time.
plotter = Plotter()
animation.FuncAnimation(plotter.fig, update, frames=range(1, n_time_steps))
Total running time of the script: (0 minutes 15.175 seconds)