Note
Go to the end to download the full example code or to run this example in your browser via Binder
Density Plot Example
This example looks at how to plot 2d density plots. The Plotter().plot_density function can be
used to plot any number of StateMutableSequence objects. StateMutableSequences are just a
container for a number of states, examples include tracks and ground truth paths. The examples
below show how to plot ground truth paths (as they’re easy to generate). The function can be used to
analyse large data sets.
Set the imports and set the start time
from datetime import datetime, timedelta
from matplotlib import animation

from stonesoup.types.groundtruth import GroundTruthPath, GroundTruthState
from stonesoup.models.transition.linear import CombinedLinearGaussianTransitionModel, \
                                               ConstantVelocity
from stonesoup.plotter import Plotter

start_time = datetime.now()
Generate the State Sequences to Plot
In these examples we’re going plot ground-truth as that is the easiest to generate. An simple function has been created to ground truth
def generate_ground_truth_path(initial_state, num_steps=20, motion_model_noise=0.01):

    transition_model = CombinedLinearGaussianTransitionModel(
        [ConstantVelocity(motion_model_noise), ConstantVelocity(motion_model_noise)])

    ground_truth = GroundTruthPath([GroundTruthState(initial_state, timestamp=start_time)])

    for k in range(0, num_steps):
        ground_truth.append(GroundTruthState(
            transition_model.function(ground_truth[k], noise=True,
                                      time_interval=timedelta(seconds=1)),
            timestamp=start_time+timedelta(seconds=k+1)))

    return ground_truth
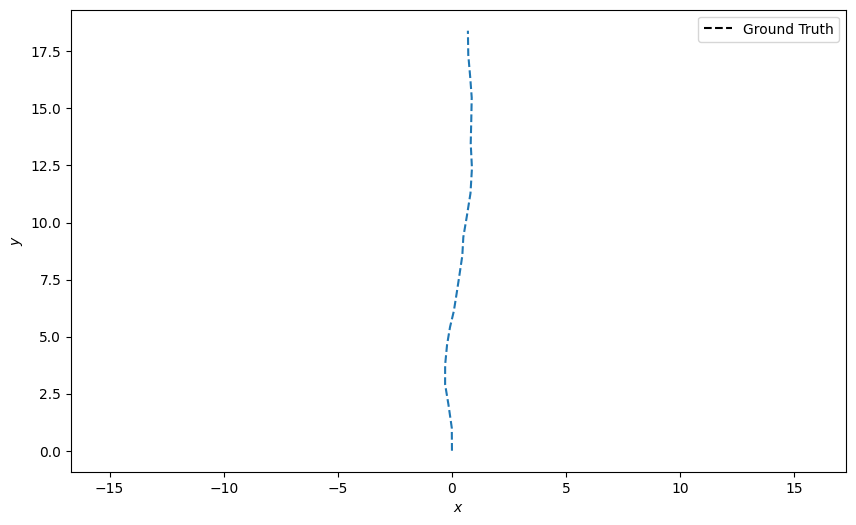
Create one ground truth path starting at the origin (0,0) and plot it
n_time_steps = 20
truth = generate_ground_truth_path(initial_state=[0, 0, 0, 1], num_steps=n_time_steps)

plotter = Plotter()
plotter.plot_ground_truths(truth, [0, 2])
[<matplotlib.lines.Line2D object at 0x7f28bb31b610>, <matplotlib.legend.Legend object at 0x7f28bb318b50>]
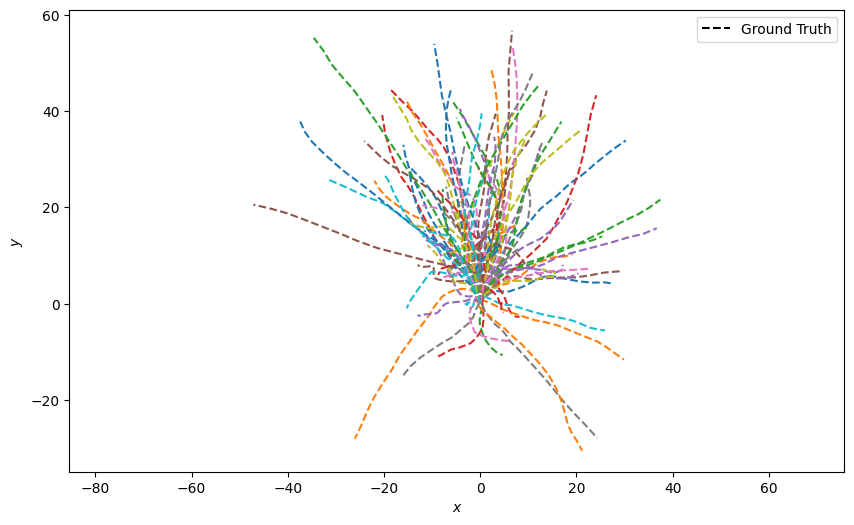
Generate 100 ground truth paths and plot them all at once. This looks quite messy
truths = [generate_ground_truth_path(initial_state=[0, 0, 0, 1],
                                     num_steps=n_time_steps,
                                     motion_model_noise=0.1)
          for _ in range(100)]

plotter = Plotter()
plotter.plot_ground_truths(set(truths), [0, 2])
[<matplotlib.lines.Line2D object at 0x7f28bae2a310>, <matplotlib.lines.Line2D object at 0x7f28bac8afd0>, <matplotlib.lines.Line2D object at 0x7f28bac8bb10>, <matplotlib.lines.Line2D object at 0x7f28bac8b590>, <matplotlib.lines.Line2D object at 0x7f28bac68190>, <matplotlib.lines.Line2D object at 0x7f28bac68f50>, <matplotlib.lines.Line2D object at 0x7f28bac693d0>, <matplotlib.lines.Line2D object at 0x7f28bac69e50>, <matplotlib.lines.Line2D object at 0x7f28bac68050>, <matplotlib.lines.Line2D object at 0x7f28bac6af10>, <matplotlib.lines.Line2D object at 0x7f28bac88150>, <matplotlib.lines.Line2D object at 0x7f28bab78c90>, <matplotlib.lines.Line2D object at 0x7f28bab799d0>, <matplotlib.lines.Line2D object at 0x7f28bab7a090>, <matplotlib.lines.Line2D object at 0x7f28bab7ae50>, <matplotlib.lines.Line2D object at 0x7f28bab7b790>, <matplotlib.lines.Line2D object at 0x7f28bb7ade10>, <matplotlib.lines.Line2D object at 0x7f28baaa6790>, <matplotlib.lines.Line2D object at 0x7f28baaa6ed0>, <matplotlib.lines.Line2D object at 0x7f28baaa7990>, <matplotlib.lines.Line2D object at 0x7f28baaa65d0>, <matplotlib.lines.Line2D object at 0x7f28baaa5650>, <matplotlib.lines.Line2D object at 0x7f28bab5cf90>, <matplotlib.lines.Line2D object at 0x7f28bab5d810>, <matplotlib.lines.Line2D object at 0x7f28bab5e410>, <matplotlib.lines.Line2D object at 0x7f28bb46c2d0>, <matplotlib.lines.Line2D object at 0x7f28bab16a90>, <matplotlib.lines.Line2D object at 0x7f28bab17910>, <matplotlib.lines.Line2D object at 0x7f28bab17590>, <matplotlib.lines.Line2D object at 0x7f28bab24990>, <matplotlib.lines.Line2D object at 0x7f28bb6c90d0>, <matplotlib.lines.Line2D object at 0x7f28bab25e10>, <matplotlib.lines.Line2D object at 0x7f28baaa6450>, <matplotlib.lines.Line2D object at 0x7f28bab274d0>, <matplotlib.lines.Line2D object at 0x7f28bab27b90>, <matplotlib.lines.Line2D object at 0x7f28bab27e50>, <matplotlib.lines.Line2D object at 0x7f28baaec910>, <matplotlib.lines.Line2D object at 0x7f28bb31fc90>, <matplotlib.lines.Line2D object at 0x7f28baaedf10>, <matplotlib.lines.Line2D object at 0x7f28bac7b290>, <matplotlib.lines.Line2D object at 0x7f28baaef810>, <matplotlib.lines.Line2D object at 0x7f28baaefc90>, <matplotlib.lines.Line2D object at 0x7f28bdc0d750>, <matplotlib.lines.Line2D object at 0x7f28baad0310>, <matplotlib.lines.Line2D object at 0x7f28bab6e9d0>, <matplotlib.lines.Line2D object at 0x7f28bab6f610>, <matplotlib.lines.Line2D object at 0x7f28bc1fc410>, <matplotlib.lines.Line2D object at 0x7f28bab34190>, <matplotlib.lines.Line2D object at 0x7f28bab6f510>, <matplotlib.lines.Line2D object at 0x7f28bab37d50>, <matplotlib.lines.Line2D object at 0x7f28ba9b4490>, <matplotlib.lines.Line2D object at 0x7f28bab6f1d0>, <matplotlib.lines.Line2D object at 0x7f28ba9b5290>, <matplotlib.lines.Line2D object at 0x7f28ba9b5fd0>, <matplotlib.lines.Line2D object at 0x7f28ba9b6610>, <matplotlib.lines.Line2D object at 0x7f28ba9b6790>, <matplotlib.lines.Line2D object at 0x7f28ba9b7bd0>, <matplotlib.lines.Line2D object at 0x7f28bab08750>, <matplotlib.lines.Line2D object at 0x7f28bab08cd0>, <matplotlib.lines.Line2D object at 0x7f28bab08290>, <matplotlib.lines.Line2D object at 0x7f28bab0a450>, <matplotlib.lines.Line2D object at 0x7f28bac69c10>, <matplotlib.lines.Line2D object at 0x7f28bb6bab90>, <matplotlib.lines.Line2D object at 0x7f28bac50d90>, <matplotlib.lines.Line2D object at 0x7f28be3517d0>, <matplotlib.lines.Line2D object at 0x7f28bac52210>, <matplotlib.lines.Line2D object at 0x7f28bac52510>, <matplotlib.lines.Line2D object at 0x7f28bb48ef10>, <matplotlib.lines.Line2D object at 0x7f28bab37450>, <matplotlib.lines.Line2D object at 0x7f28bc5e7610>, <matplotlib.lines.Line2D object at 0x7f28bc5e7e50>, <matplotlib.lines.Line2D object at 0x7f28bc5e4cd0>, <matplotlib.lines.Line2D object at 0x7f28ba06eb10>, <matplotlib.lines.Line2D object at 0x7f28ba06ead0>, <matplotlib.lines.Line2D object at 0x7f28baaa7390>, <matplotlib.lines.Line2D object at 0x7f28b9eb45d0>, <matplotlib.lines.Line2D object at 0x7f28bc706550>, <matplotlib.lines.Line2D object at 0x7f28bab27090>, <matplotlib.lines.Line2D object at 0x7f28b9eb6e90>, <matplotlib.lines.Line2D object at 0x7f28bab259d0>, <matplotlib.lines.Line2D object at 0x7f28b9ecad50>, <matplotlib.lines.Line2D object at 0x7f28b9ecba90>, <matplotlib.lines.Line2D object at 0x7f28b9ecb8d0>, <matplotlib.lines.Line2D object at 0x7f28b9ec9190>, <matplotlib.lines.Line2D object at 0x7f28bac31c10>, <matplotlib.lines.Line2D object at 0x7f28bac6a8d0>, <matplotlib.lines.Line2D object at 0x7f28bab0a4d0>, <matplotlib.lines.Line2D object at 0x7f28b9ee0b90>, <matplotlib.lines.Line2D object at 0x7f28b9ee1710>, <matplotlib.lines.Line2D object at 0x7f28b9ee22d0>, <matplotlib.lines.Line2D object at 0x7f28bac69950>, <matplotlib.lines.Line2D object at 0x7f28bab7b750>, <matplotlib.lines.Line2D object at 0x7f28badfe650>, <matplotlib.lines.Line2D object at 0x7f28badfec10>, <matplotlib.lines.Line2D object at 0x7f28bab27790>, <matplotlib.lines.Line2D object at 0x7f28baaa63d0>, <matplotlib.lines.Line2D object at 0x7f28baf346d0>, <matplotlib.lines.Line2D object at 0x7f28bab24f50>, <matplotlib.lines.Line2D object at 0x7f28bab25bd0>, <matplotlib.lines.Line2D object at 0x7f28baf36350>, <matplotlib.legend.Legend object at 0x7f28bb3eb4d0>]
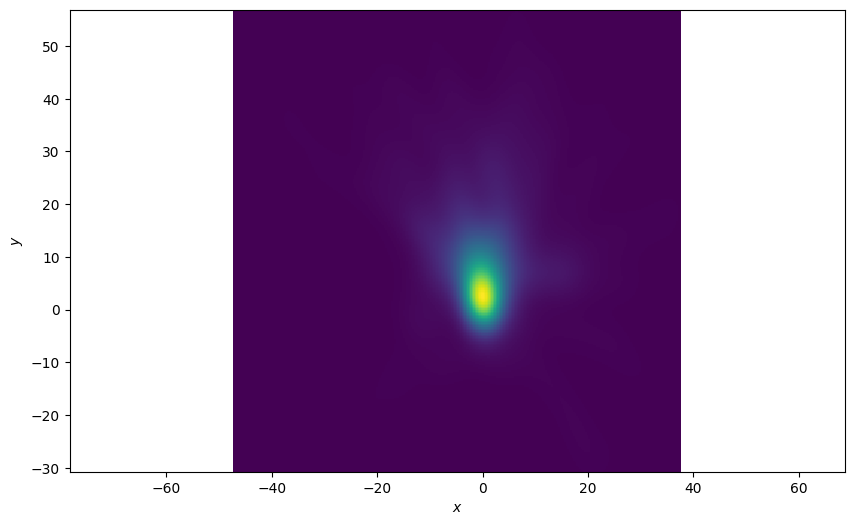
Density Plot of All States
Plot a 2d density plot for all the states in the ground-truth. This is clearer, we can see a clear concentration around the origin where all the tracks start
plotter = Plotter()
plotter.plot_density(truths, index=None)
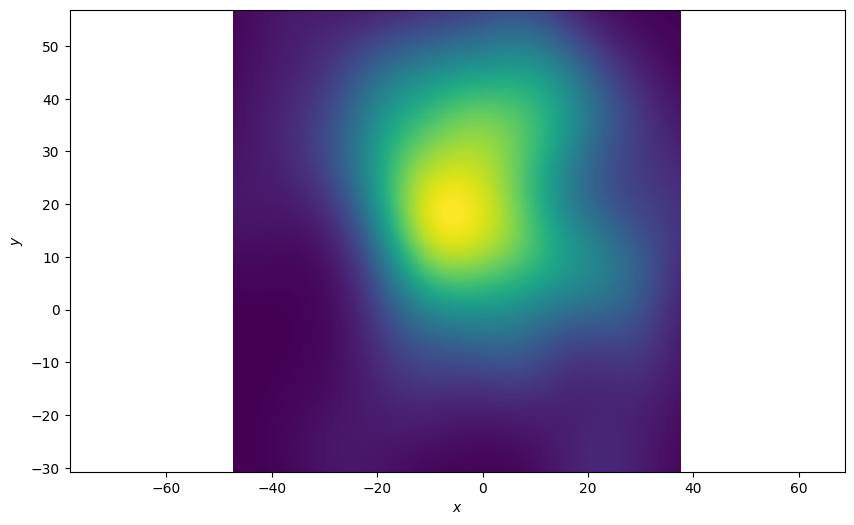
Plot of the Last State of the Ground Truths
The function allows you to pick an index of the state sequence (ground truth in this example) to plot. In this example we’re only interested in the final state of the sequences. An index of ‘-1’ is the last state in the sequence. The resultant plot is much more spread out
plotter = Plotter()
plotter.plot_density(truths, index=-1)
Plot each state over time
Plot the density at each time-step and see how the density plot evolves. Define an animation update function.
def update(i):
    plotter.ax.clear()
    plotter.plot_density(truths, index=i)
    return plotter.ax
Plot the densities over time.
plotter = Plotter()
animation.FuncAnimation(plotter.fig, update, frames=range(1, n_time_steps))
Total running time of the script: ( 0 minutes 22.885 seconds)