Note
Go to the end to download the full example code or to run this example in your browser via Binder.
Density Plot Example
This example looks at how to plot 2d density plots. The Plotter().plot_density function can be
used to plot any number of StateMutableSequence objects. StateMutableSequences are just a
container for a number of states - examples include tracks and ground truth paths. The examples
below show how to plot ground truth paths (as they’re easy to generate). The function can be used to
analyse large data sets.
Set the imports and set the start time
from datetime import datetime, timedelta
from matplotlib import animation

from stonesoup.types.groundtruth import GroundTruthPath, GroundTruthState
from stonesoup.models.transition.linear import CombinedLinearGaussianTransitionModel, \
                                               ConstantVelocity
from stonesoup.plotter import Plotter

start_time = datetime.now()
Generate the State Sequences to Plot
In this example we will plot ground truth paths due to their ease of creation. The ground truths are created in the following function:
def generate_ground_truth_path(initial_state, num_steps=20, motion_model_noise=0.01):

    transition_model = CombinedLinearGaussianTransitionModel(
        [ConstantVelocity(motion_model_noise), ConstantVelocity(motion_model_noise)])

    ground_truth = GroundTruthPath([GroundTruthState(initial_state, timestamp=start_time)])

    for k in range(0, num_steps):
        ground_truth.append(GroundTruthState(
            transition_model.function(ground_truth[k], noise=True,
                                      time_interval=timedelta(seconds=1)),
            timestamp=start_time+timedelta(seconds=k+1)))

    return ground_truth
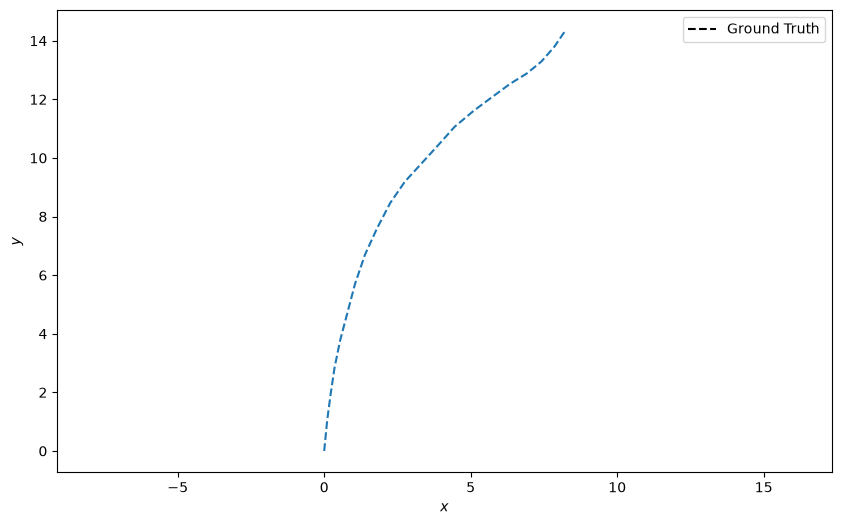
Create one ground truth path starting at the origin (0, 0) and plot it:
n_time_steps = 20
truth = generate_ground_truth_path(initial_state=[0, 0, 0, 1], num_steps=n_time_steps)

plotter = Plotter()
plotter.plot_ground_truths(truth, [0, 2])
[<matplotlib.lines.Line2D object at 0x76caf1c49010>, <matplotlib.legend.Legend object at 0x76caf1c4b650>]
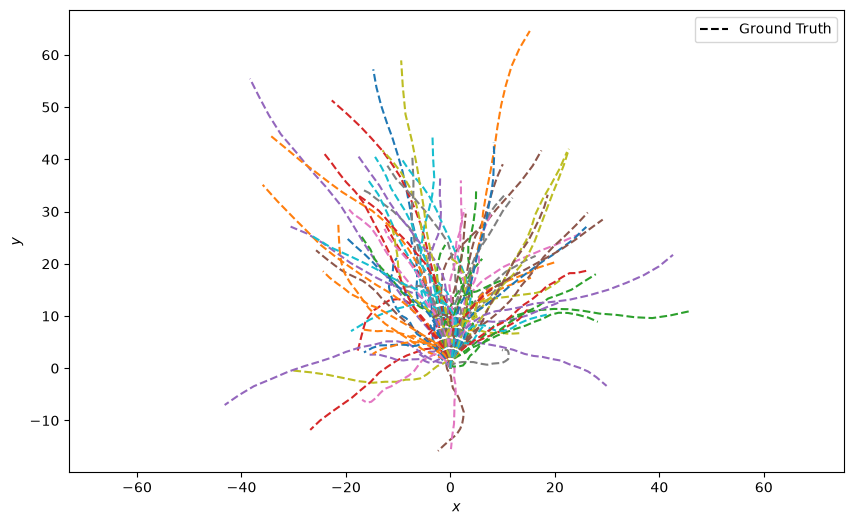
Generate 100 ground truth paths and plot them all at once. This looks quite messy:
truths = [generate_ground_truth_path(initial_state=[0, 0, 0, 1],
                                     num_steps=n_time_steps,
                                     motion_model_noise=0.1)
          for _ in range(100)]

plotter = Plotter()
plotter.plot_ground_truths(set(truths), [0, 2])
[<matplotlib.lines.Line2D object at 0x76cae0a928a0>, <matplotlib.lines.Line2D object at 0x76cad2ce7dd0>, <matplotlib.lines.Line2D object at 0x76cadb17a8a0>, <matplotlib.lines.Line2D object at 0x76cad2ca1070>, <matplotlib.lines.Line2D object at 0x76cad3d6d6d0>, <matplotlib.lines.Line2D object at 0x76cad3d6c920>, <matplotlib.lines.Line2D object at 0x76cad2af4830>, <matplotlib.lines.Line2D object at 0x76cad2af42f0>, <matplotlib.lines.Line2D object at 0x76cad2af6f00>, <matplotlib.lines.Line2D object at 0x76cad4137f20>, <matplotlib.lines.Line2D object at 0x76cad41352e0>, <matplotlib.lines.Line2D object at 0x76cad4137ce0>, <matplotlib.lines.Line2D object at 0x76cad4137d70>, <matplotlib.lines.Line2D object at 0x76cad4134620>, <matplotlib.lines.Line2D object at 0x76cad4137e30>, <matplotlib.lines.Line2D object at 0x76cad4136d50>, <matplotlib.lines.Line2D object at 0x76cad4137590>, <matplotlib.lines.Line2D object at 0x76cad41356a0>, <matplotlib.lines.Line2D object at 0x76cad41368a0>, <matplotlib.lines.Line2D object at 0x76cad4136000>, <matplotlib.lines.Line2D object at 0x76cad4135ac0>, <matplotlib.lines.Line2D object at 0x76cad4134fb0>, <matplotlib.lines.Line2D object at 0x76cad4134b30>, <matplotlib.lines.Line2D object at 0x76cad4135be0>, <matplotlib.lines.Line2D object at 0x76cad4134ec0>, <matplotlib.lines.Line2D object at 0x76cad4137a40>, <matplotlib.lines.Line2D object at 0x76cad41358e0>, <matplotlib.lines.Line2D object at 0x76cad4136d80>, <matplotlib.lines.Line2D object at 0x76cad4136510>, <matplotlib.lines.Line2D object at 0x76cad4135520>, <matplotlib.lines.Line2D object at 0x76cad41374d0>, <matplotlib.lines.Line2D object at 0x76cad4137f50>, <matplotlib.lines.Line2D object at 0x76cad4136360>, <matplotlib.lines.Line2D object at 0x76caf0b08110>, <matplotlib.lines.Line2D object at 0x76cae0aee8a0>, <matplotlib.lines.Line2D object at 0x76cae0aee150>, <matplotlib.lines.Line2D object at 0x76cae0aedbb0>, <matplotlib.lines.Line2D object at 0x76cadb68e840>, <matplotlib.lines.Line2D object at 0x76cadb68fcb0>, <matplotlib.lines.Line2D object at 0x76cadb68cd70>, <matplotlib.lines.Line2D object at 0x76cadb68fa40>, <matplotlib.lines.Line2D object at 0x76cadb68e6f0>, <matplotlib.lines.Line2D object at 0x76cadb68f200>, <matplotlib.lines.Line2D object at 0x76cadb68ea50>, <matplotlib.lines.Line2D object at 0x76cadb68fe00>, <matplotlib.lines.Line2D object at 0x76cadb68e9c0>, <matplotlib.lines.Line2D object at 0x76cadb68ca40>, <matplotlib.lines.Line2D object at 0x76cadb68dd30>, <matplotlib.lines.Line2D object at 0x76cadb68eed0>, <matplotlib.lines.Line2D object at 0x76cadb68e510>, <matplotlib.lines.Line2D object at 0x76cadb68c0e0>, <matplotlib.lines.Line2D object at 0x76cad42fe7b0>, <matplotlib.lines.Line2D object at 0x76cad42fddf0>, <matplotlib.lines.Line2D object at 0x76cad42fdf10>, <matplotlib.lines.Line2D object at 0x76cad42fd880>, <matplotlib.lines.Line2D object at 0x76cad42fe720>, <matplotlib.lines.Line2D object at 0x76cad42fe420>, <matplotlib.lines.Line2D object at 0x76cad42fec90>, <matplotlib.lines.Line2D object at 0x76cad42fd520>, <matplotlib.lines.Line2D object at 0x76cad42fe240>, <matplotlib.lines.Line2D object at 0x76cad42ff440>, <matplotlib.lines.Line2D object at 0x76cad42ff650>, <matplotlib.lines.Line2D object at 0x76cad42fe060>, <matplotlib.lines.Line2D object at 0x76cad42ffb90>, <matplotlib.lines.Line2D object at 0x76cad42fcf50>, <matplotlib.lines.Line2D object at 0x76cad42ffce0>, <matplotlib.lines.Line2D object at 0x76cad42fd0a0>, <matplotlib.lines.Line2D object at 0x76cad42fc5c0>, <matplotlib.lines.Line2D object at 0x76cad42fc950>, <matplotlib.lines.Line2D object at 0x76cad42fcb00>, <matplotlib.lines.Line2D object at 0x76cad42fdc40>, <matplotlib.lines.Line2D object at 0x76cad42fedb0>, <matplotlib.lines.Line2D object at 0x76cad42fcda0>, <matplotlib.lines.Line2D object at 0x76cad42fcd10>, <matplotlib.lines.Line2D object at 0x76cad42ff620>, <matplotlib.lines.Line2D object at 0x76cad42fc9b0>, <matplotlib.lines.Line2D object at 0x76cad2b96480>, <matplotlib.lines.Line2D object at 0x76cad2b95fa0>, <matplotlib.lines.Line2D object at 0x76cad2b96cc0>, <matplotlib.lines.Line2D object at 0x76cad2b94ce0>, <matplotlib.lines.Line2D object at 0x76cad2b94620>, <matplotlib.lines.Line2D object at 0x76cad2b96a50>, <matplotlib.lines.Line2D object at 0x76cad2b95a60>, <matplotlib.lines.Line2D object at 0x76cad2b963c0>, <matplotlib.lines.Line2D object at 0x76cad2b97110>, <matplotlib.lines.Line2D object at 0x76cad2b97710>, <matplotlib.lines.Line2D object at 0x76cad2b94d10>, <matplotlib.lines.Line2D object at 0x76cad2b94f80>, <matplotlib.lines.Line2D object at 0x76cad2b972c0>, <matplotlib.lines.Line2D object at 0x76cad2b974a0>, <matplotlib.lines.Line2D object at 0x76cad2b96fc0>, <matplotlib.lines.Line2D object at 0x76cad2b97ec0>, <matplotlib.lines.Line2D object at 0x76cad2b948c0>, <matplotlib.lines.Line2D object at 0x76cad2b95d30>, <matplotlib.lines.Line2D object at 0x76cad2b96d50>, <matplotlib.lines.Line2D object at 0x76cad2b956d0>, <matplotlib.lines.Line2D object at 0x76cad2b94bc0>, <matplotlib.lines.Line2D object at 0x76cb12451220>, <matplotlib.lines.Line2D object at 0x76cb12450d40>, <matplotlib.lines.Line2D object at 0x76cb12451730>, <matplotlib.legend.Legend object at 0x76cb124531a0>]
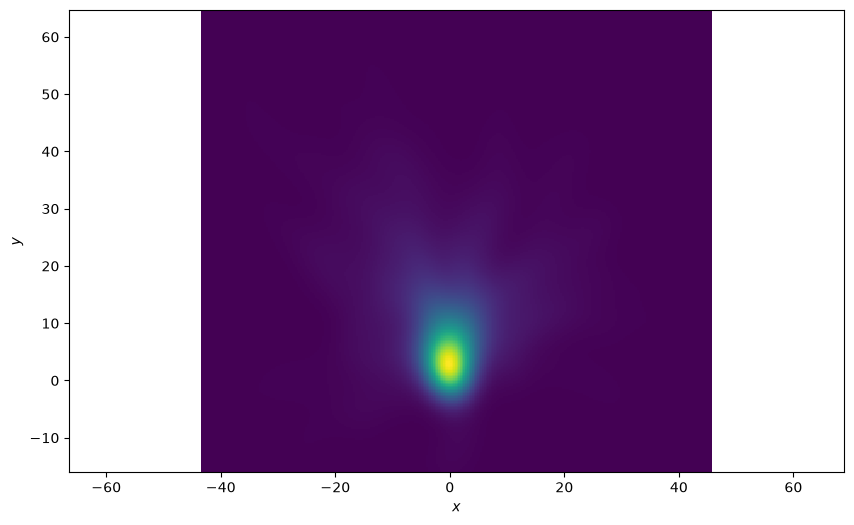
Density Plot of All States
Plot a 2D density plot for all the states in the ground truths. This is a better visualisation because we can see a clear concentration of states around the origin where all the tracks start.
plotter = Plotter()
plotter.plot_density(truths, index=None)
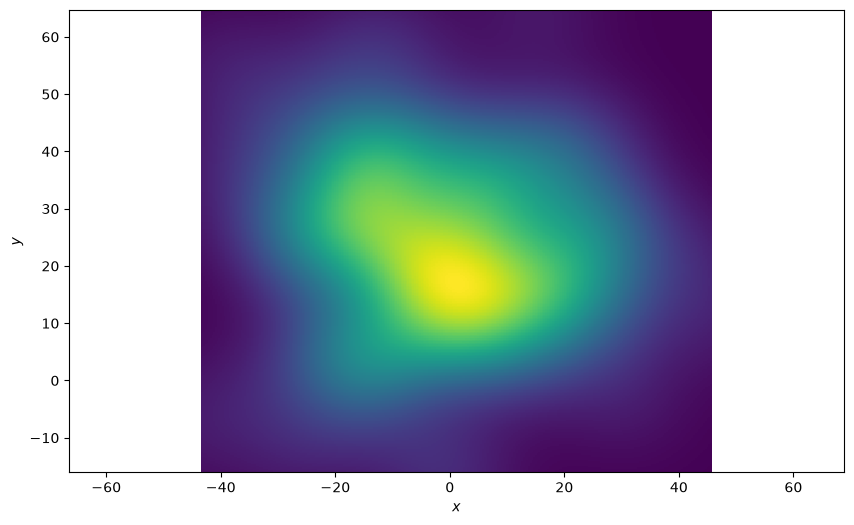
Plot of the Last State of the Ground Truths
The function allows you to pick an index of the state sequence (ground truth in this example) to plot. In this example we’re only interested in the final state of the sequences. An index of ‘-1’ is the last state in the sequence. The resultant plot is much more spread out.
plotter = Plotter()
plotter.plot_density(truths, index=-1)
Plot each state over time
Plot the density at each time-step and see how the density plot evolves. Define an animation update function.
def update(i):
    plotter.ax.clear()
    plotter.plot_density(truths, index=i)
    return plotter.ax
Finally, plot the densities over time.
plotter = Plotter()
animation.FuncAnimation(plotter.fig, update, frames=range(1, n_time_steps))
Total running time of the script: (0 minutes 15.122 seconds)