Note
Go to the end to download the full example code. or to run this example in your browser via Binder
Density Plot Example
This example looks at how to plot 2d density plots. The Plotter().plot_density function can be
used to plot any number of StateMutableSequence objects. StateMutableSequences are just a
container for a number of states - examples include tracks and ground truth paths. The examples
below show how to plot ground truth paths (as they’re easy to generate). The function can be used to
analyse large data sets.
Set the imports and set the start time
from datetime import datetime, timedelta
from matplotlib import animation

from stonesoup.types.groundtruth import GroundTruthPath, GroundTruthState
from stonesoup.models.transition.linear import CombinedLinearGaussianTransitionModel, \
                                               ConstantVelocity
from stonesoup.plotter import Plotter

start_time = datetime.now()
Generate the State Sequences to Plot
In this example we will plot ground truth paths due to their ease of creation. The ground truths are created in the following function:
def generate_ground_truth_path(initial_state, num_steps=20, motion_model_noise=0.01):

    transition_model = CombinedLinearGaussianTransitionModel(
        [ConstantVelocity(motion_model_noise), ConstantVelocity(motion_model_noise)])

    ground_truth = GroundTruthPath([GroundTruthState(initial_state, timestamp=start_time)])

    for k in range(0, num_steps):
        ground_truth.append(GroundTruthState(
            transition_model.function(ground_truth[k], noise=True,
                                      time_interval=timedelta(seconds=1)),
            timestamp=start_time+timedelta(seconds=k+1)))

    return ground_truth
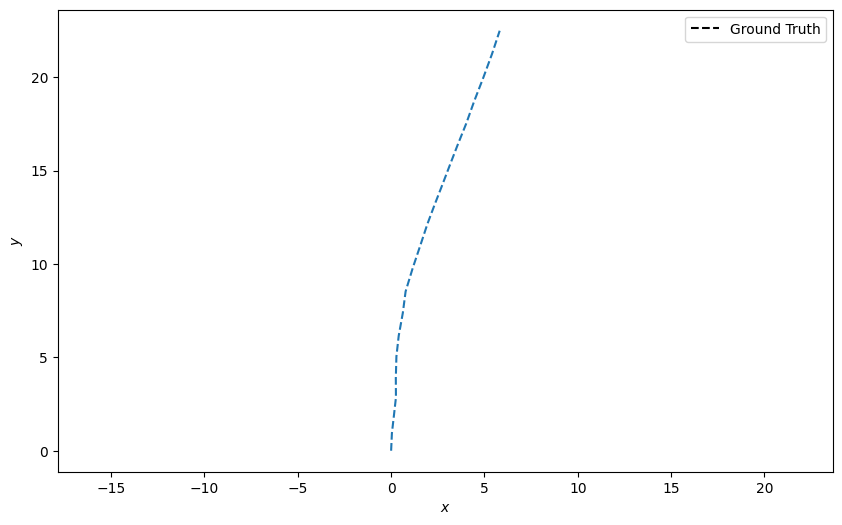
Create one ground truth path starting at the origin (0, 0) and plot it:
n_time_steps = 20
truth = generate_ground_truth_path(initial_state=[0, 0, 0, 1], num_steps=n_time_steps)

plotter = Plotter()
plotter.plot_ground_truths(truth, [0, 2])
[<matplotlib.lines.Line2D object at 0x7e153f9d67b0>, <matplotlib.legend.Legend object at 0x7e153c4ebd70>]
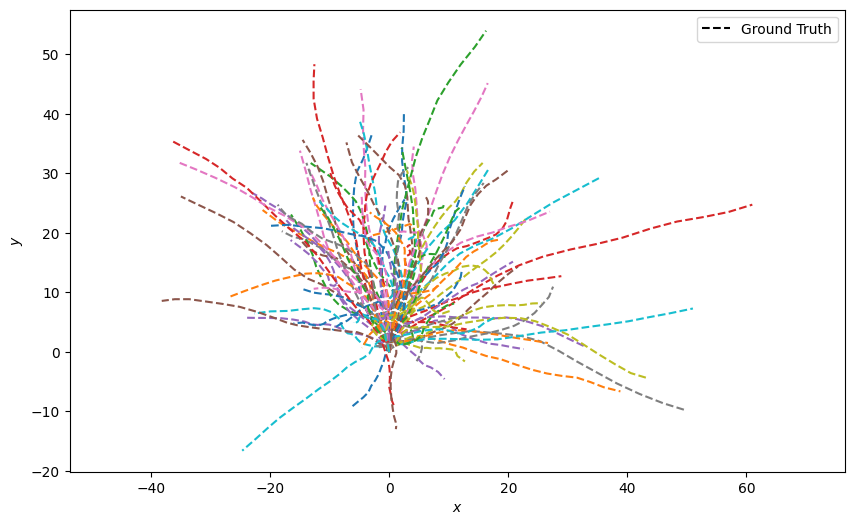
Generate 100 ground truth paths and plot them all at once. This looks quite messy:
truths = [generate_ground_truth_path(initial_state=[0, 0, 0, 1],
                                     num_steps=n_time_steps,
                                     motion_model_noise=0.1)
          for _ in range(100)]

plotter = Plotter()
plotter.plot_ground_truths(set(truths), [0, 2])
[<matplotlib.lines.Line2D object at 0x7e153fa24c20>, <matplotlib.lines.Line2D object at 0x7e153c143890>, <matplotlib.lines.Line2D object at 0x7e153c197440>, <matplotlib.lines.Line2D object at 0x7e153592c2f0>, <matplotlib.lines.Line2D object at 0x7e153592fad0>, <matplotlib.lines.Line2D object at 0x7e153592e0c0>, <matplotlib.lines.Line2D object at 0x7e153592fe90>, <matplotlib.lines.Line2D object at 0x7e153592f710>, <matplotlib.lines.Line2D object at 0x7e153592f2f0>, <matplotlib.lines.Line2D object at 0x7e153592ea80>, <matplotlib.lines.Line2D object at 0x7e153592e870>, <matplotlib.lines.Line2D object at 0x7e153592da30>, <matplotlib.lines.Line2D object at 0x7e15609b1eb0>, <matplotlib.lines.Line2D object at 0x7e15609b2f30>, <matplotlib.lines.Line2D object at 0x7e15609b1df0>, <matplotlib.lines.Line2D object at 0x7e15609b10a0>, <matplotlib.lines.Line2D object at 0x7e1528f6b0e0>, <matplotlib.lines.Line2D object at 0x7e1528f6a780>, <matplotlib.lines.Line2D object at 0x7e1528f6ab40>, <matplotlib.lines.Line2D object at 0x7e1528f694f0>, <matplotlib.lines.Line2D object at 0x7e1528f68fb0>, <matplotlib.lines.Line2D object at 0x7e1528f693d0>, <matplotlib.lines.Line2D object at 0x7e1528f6b9e0>, <matplotlib.lines.Line2D object at 0x7e1528f6b2f0>, <matplotlib.lines.Line2D object at 0x7e1528f6b500>, <matplotlib.lines.Line2D object at 0x7e1528f6a450>, <matplotlib.lines.Line2D object at 0x7e1528f693a0>, <matplotlib.lines.Line2D object at 0x7e1528f69df0>, <matplotlib.lines.Line2D object at 0x7e1528f68800>, <matplotlib.lines.Line2D object at 0x7e1528f6b440>, <matplotlib.lines.Line2D object at 0x7e1528f6b6e0>, <matplotlib.lines.Line2D object at 0x7e1528f6ab70>, <matplotlib.lines.Line2D object at 0x7e1528f69be0>, <matplotlib.lines.Line2D object at 0x7e1528f68b60>, <matplotlib.lines.Line2D object at 0x7e1528f6bfb0>, <matplotlib.lines.Line2D object at 0x7e1528f684d0>, <matplotlib.lines.Line2D object at 0x7e153f711070>, <matplotlib.lines.Line2D object at 0x7e1529017470>, <matplotlib.lines.Line2D object at 0x7e1529017b00>, <matplotlib.lines.Line2D object at 0x7e15290174d0>, <matplotlib.lines.Line2D object at 0x7e15290170b0>, <matplotlib.lines.Line2D object at 0x7e1529017b30>, <matplotlib.lines.Line2D object at 0x7e1529016ed0>, <matplotlib.lines.Line2D object at 0x7e152904e960>, <matplotlib.lines.Line2D object at 0x7e152904fbf0>, <matplotlib.lines.Line2D object at 0x7e152904e630>, <matplotlib.lines.Line2D object at 0x7e152904f890>, <matplotlib.lines.Line2D object at 0x7e152904d1c0>, <matplotlib.lines.Line2D object at 0x7e152904c080>, <matplotlib.lines.Line2D object at 0x7e152904f710>, <matplotlib.lines.Line2D object at 0x7e152904e870>, <matplotlib.lines.Line2D object at 0x7e152904d850>, <matplotlib.lines.Line2D object at 0x7e152904e060>, <matplotlib.lines.Line2D object at 0x7e152904dca0>, <matplotlib.lines.Line2D object at 0x7e152904e240>, <matplotlib.lines.Line2D object at 0x7e152904ecc0>, <matplotlib.lines.Line2D object at 0x7e1535f4c4a0>, <matplotlib.lines.Line2D object at 0x7e1535f4c500>, <matplotlib.lines.Line2D object at 0x7e1535f4cc20>, <matplotlib.lines.Line2D object at 0x7e1535f4d4c0>, <matplotlib.lines.Line2D object at 0x7e1535f4c440>, <matplotlib.lines.Line2D object at 0x7e1535f4c050>, <matplotlib.lines.Line2D object at 0x7e1528eaccb0>, <matplotlib.lines.Line2D object at 0x7e1528eacaa0>, <matplotlib.lines.Line2D object at 0x7e1528ead850>, <matplotlib.lines.Line2D object at 0x7e1528eaed50>, <matplotlib.lines.Line2D object at 0x7e1528eac0b0>, <matplotlib.lines.Line2D object at 0x7e1528ead670>, <matplotlib.lines.Line2D object at 0x7e1528eac9e0>, <matplotlib.lines.Line2D object at 0x7e1528eaf410>, <matplotlib.lines.Line2D object at 0x7e1528ead9d0>, <matplotlib.lines.Line2D object at 0x7e1528eaf650>, <matplotlib.lines.Line2D object at 0x7e1528eaf110>, <matplotlib.lines.Line2D object at 0x7e1528eac6b0>, <matplotlib.lines.Line2D object at 0x7e1528eaf4d0>, <matplotlib.lines.Line2D object at 0x7e1528eac650>, <matplotlib.lines.Line2D object at 0x7e1528eadaf0>, <matplotlib.lines.Line2D object at 0x7e1528eae8d0>, <matplotlib.lines.Line2D object at 0x7e1528ead640>, <matplotlib.lines.Line2D object at 0x7e1528eacd10>, <matplotlib.lines.Line2D object at 0x7e1528eadf40>, <matplotlib.lines.Line2D object at 0x7e1528eac0e0>, <matplotlib.lines.Line2D object at 0x7e1528eacf20>, <matplotlib.lines.Line2D object at 0x7e1528eacda0>, <matplotlib.lines.Line2D object at 0x7e1535f025a0>, <matplotlib.lines.Line2D object at 0x7e1535f030e0>, <matplotlib.lines.Line2D object at 0x7e1535941790>, <matplotlib.lines.Line2D object at 0x7e1535942480>, <matplotlib.lines.Line2D object at 0x7e1535942bd0>, <matplotlib.lines.Line2D object at 0x7e1535940050>, <matplotlib.lines.Line2D object at 0x7e1535942840>, <matplotlib.lines.Line2D object at 0x7e1535940350>, <matplotlib.lines.Line2D object at 0x7e1535941820>, <matplotlib.lines.Line2D object at 0x7e1535941130>, <matplotlib.lines.Line2D object at 0x7e1535941c40>, <matplotlib.lines.Line2D object at 0x7e15359425d0>, <matplotlib.lines.Line2D object at 0x7e1535941910>, <matplotlib.lines.Line2D object at 0x7e1535943200>, <matplotlib.lines.Line2D object at 0x7e1535943800>, <matplotlib.lines.Line2D object at 0x7e1535943230>, <matplotlib.legend.Legend object at 0x7e1528f07d10>]
Density Plot of All States
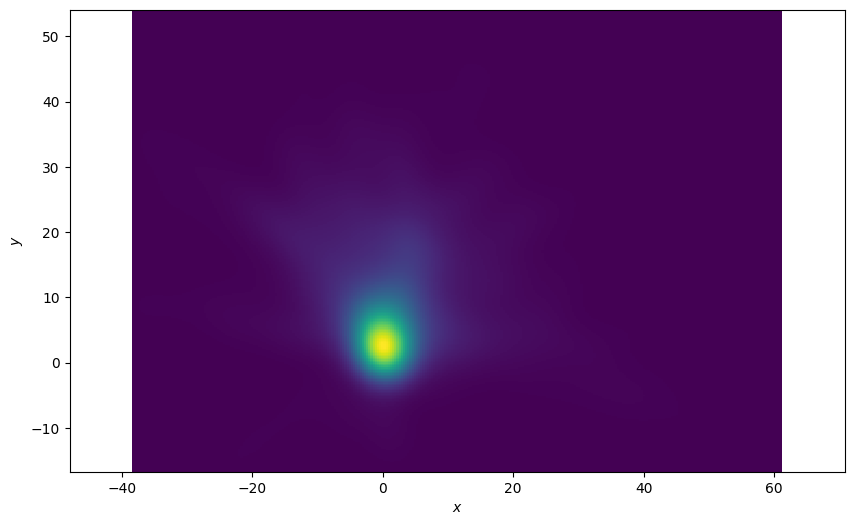
Plot a 2D density plot for all the states in the ground truths. This is a better visualisation because we can see a clear concentration of states around the origin where all the tracks start.
plotter = Plotter()
plotter.plot_density(truths, index=None)
Plot of the Last State of the Ground Truths
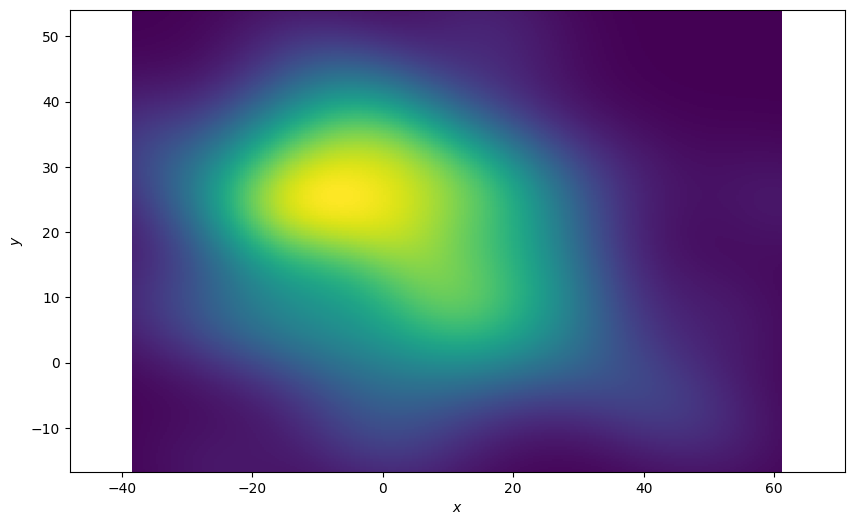
The function allows you to pick an index of the state sequence (ground truth in this example) to plot. In this example we’re only interested in the final state of the sequences. An index of ‘-1’ is the last state in the sequence. The resultant plot is much more spread out.
plotter = Plotter()
plotter.plot_density(truths, index=-1)
Plot each state over time
Plot the density at each time-step and see how the density plot evolves. Define an animation update function.
def update(i):
    plotter.ax.clear()
    plotter.plot_density(truths, index=i)
    return plotter.ax
Finally, plot the densities over time.
plotter = Plotter()
animation.FuncAnimation(plotter.fig, update, frames=range(1, n_time_steps))
Total running time of the script: (0 minutes 10.246 seconds)
