Note
Go to the end to download the full example code. or to run this example in your browser via Binder
Density Plot Example
This example looks at how to plot 2d density plots. The Plotter().plot_density function can be
used to plot any number of StateMutableSequence objects. StateMutableSequences are just a
container for a number of states - examples include tracks and ground truth paths. The examples
below show how to plot ground truth paths (as they’re easy to generate). The function can be used to
analyse large data sets.
Set the imports and set the start time
from datetime import datetime, timedelta
from matplotlib import animation

from stonesoup.types.groundtruth import GroundTruthPath, GroundTruthState
from stonesoup.models.transition.linear import CombinedLinearGaussianTransitionModel, \
                                               ConstantVelocity
from stonesoup.plotter import Plotter

start_time = datetime.now()
Generate the State Sequences to Plot
In this example we will plot ground truth paths due to their ease of creation. The ground truths are created in the following function:
def generate_ground_truth_path(initial_state, num_steps=20, motion_model_noise=0.01):

    transition_model = CombinedLinearGaussianTransitionModel(
        [ConstantVelocity(motion_model_noise), ConstantVelocity(motion_model_noise)])

    ground_truth = GroundTruthPath([GroundTruthState(initial_state, timestamp=start_time)])

    for k in range(0, num_steps):
        ground_truth.append(GroundTruthState(
            transition_model.function(ground_truth[k], noise=True,
                                      time_interval=timedelta(seconds=1)),
            timestamp=start_time+timedelta(seconds=k+1)))

    return ground_truth
Create one ground truth path starting at the origin (0, 0) and plot it:
n_time_steps = 20
truth = generate_ground_truth_path(initial_state=[0, 0, 0, 1], num_steps=n_time_steps)

plotter = Plotter()
plotter.plot_ground_truths(truth, [0, 2])

[<matplotlib.lines.Line2D object at 0x7fea343866c0>, <matplotlib.legend.Legend object at 0x7fea343850d0>]
Generate 100 ground truth paths and plot them all at once. This looks quite messy:
truths = [generate_ground_truth_path(initial_state=[0, 0, 0, 1],
                                     num_steps=n_time_steps,
                                     motion_model_noise=0.1)
          for _ in range(100)]

plotter = Plotter()
plotter.plot_ground_truths(set(truths), [0, 2])

[<matplotlib.lines.Line2D object at 0x7fea34386a80>, <matplotlib.lines.Line2D object at 0x7fea357871a0>, <matplotlib.lines.Line2D object at 0x7fea399584d0>, <matplotlib.lines.Line2D object at 0x7fea3995ad20>, <matplotlib.lines.Line2D object at 0x7fea39958560>, <matplotlib.lines.Line2D object at 0x7fea3995b350>, <matplotlib.lines.Line2D object at 0x7fea399584a0>, <matplotlib.lines.Line2D object at 0x7fea3995b050>, <matplotlib.lines.Line2D object at 0x7fea3995ac90>, <matplotlib.lines.Line2D object at 0x7fea39958cb0>, <matplotlib.lines.Line2D object at 0x7fea3995bb60>, <matplotlib.lines.Line2D object at 0x7fea39959460>, <matplotlib.lines.Line2D object at 0x7fea3995bdd0>, <matplotlib.lines.Line2D object at 0x7fea3995acf0>, <matplotlib.lines.Line2D object at 0x7fea3995b590>, <matplotlib.lines.Line2D object at 0x7fea3995bb00>, <matplotlib.lines.Line2D object at 0x7fea3995ab10>, <matplotlib.lines.Line2D object at 0x7fea39959610>, <matplotlib.lines.Line2D object at 0x7fea3995b200>, <matplotlib.lines.Line2D object at 0x7fea39959f40>, <matplotlib.lines.Line2D object at 0x7fea3a9083b0>, <matplotlib.lines.Line2D object at 0x7fea3a909ac0>, <matplotlib.lines.Line2D object at 0x7fea35660d40>, <matplotlib.lines.Line2D object at 0x7fea35662cc0>, <matplotlib.lines.Line2D object at 0x7fea35660b00>, <matplotlib.lines.Line2D object at 0x7fea35661610>, <matplotlib.lines.Line2D object at 0x7fea35663140>, <matplotlib.lines.Line2D object at 0x7fea356614f0>, <matplotlib.lines.Line2D object at 0x7fea35662750>, <matplotlib.lines.Line2D object at 0x7fea35661d90>, <matplotlib.lines.Line2D object at 0x7fea35660740>, <matplotlib.lines.Line2D object at 0x7fea35660e60>, <matplotlib.lines.Line2D object at 0x7fea35663b90>, <matplotlib.lines.Line2D object at 0x7fea35662a80>, <matplotlib.lines.Line2D object at 0x7fea356632f0>, <matplotlib.lines.Line2D object at 0x7fea35660110>, <matplotlib.lines.Line2D object at 0x7fea35662180>, <matplotlib.lines.Line2D object at 0x7fea35663260>, <matplotlib.lines.Line2D object at 0x7fea35662e40>, <matplotlib.lines.Line2D object at 0x7fea35662990>, <matplotlib.lines.Line2D object at 0x7fea35660950>, <matplotlib.lines.Line2D object at 0x7fea35661a60>, <matplotlib.lines.Line2D object at 0x7fea35663e30>, <matplotlib.lines.Line2D object at 0x7fea35660ef0>, <matplotlib.lines.Line2D object at 0x7fea342c1220>, <matplotlib.lines.Line2D object at 0x7fea342c32c0>, <matplotlib.lines.Line2D object at 0x7fea342c2900>, <matplotlib.lines.Line2D object at 0x7fea342c1670>, <matplotlib.lines.Line2D object at 0x7fea342c1d30>, <matplotlib.lines.Line2D object at 0x7fea342c0da0>, <matplotlib.lines.Line2D object at 0x7fea342c0cb0>, <matplotlib.lines.Line2D object at 0x7fea342c1a90>, <matplotlib.lines.Line2D object at 0x7fea342c2840>, <matplotlib.lines.Line2D object at 0x7fea39683a40>, <matplotlib.lines.Line2D object at 0x7fea39681e20>, <matplotlib.lines.Line2D object at 0x7fea39680b90>, <matplotlib.lines.Line2D object at 0x7fea39680fe0>, <matplotlib.lines.Line2D object at 0x7fea39681eb0>, <matplotlib.lines.Line2D object at 0x7fea39680920>, <matplotlib.lines.Line2D object at 0x7fea39680050>, <matplotlib.lines.Line2D object at 0x7fea39683410>, <matplotlib.lines.Line2D object at 0x7fea396812b0>, <matplotlib.lines.Line2D object at 0x7fea39681e50>, <matplotlib.lines.Line2D object at 0x7fea39682e10>, <matplotlib.lines.Line2D object at 0x7fea39681580>, <matplotlib.lines.Line2D object at 0x7fea396810a0>, <matplotlib.lines.Line2D object at 0x7fea39681d90>, <matplotlib.lines.Line2D object at 0x7fea39680080>, <matplotlib.lines.Line2D object at 0x7fea39680c80>, <matplotlib.lines.Line2D object at 0x7fea39680590>, <matplotlib.lines.Line2D object at 0x7fea39683800>, <matplotlib.lines.Line2D object at 0x7fea396824b0>, <matplotlib.lines.Line2D object at 0x7fea39681f40>, <matplotlib.lines.Line2D object at 0x7fea39682cc0>, <matplotlib.lines.Line2D object at 0x7fea39683890>, <matplotlib.lines.Line2D object at 0x7fea3569baa0>, <matplotlib.lines.Line2D object at 0x7fea35699ca0>, <matplotlib.lines.Line2D object at 0x7fea35699370>, <matplotlib.lines.Line2D object at 0x7fea3569af00>, <matplotlib.lines.Line2D object at 0x7fea3569aed0>, <matplotlib.lines.Line2D object at 0x7fea3569ba40>, <matplotlib.lines.Line2D object at 0x7fea356983e0>, <matplotlib.lines.Line2D object at 0x7fea35698c50>, <matplotlib.lines.Line2D object at 0x7fea3569af60>, <matplotlib.lines.Line2D object at 0x7fea3569aa20>, <matplotlib.lines.Line2D object at 0x7fea3569a360>, <matplotlib.lines.Line2D object at 0x7fea35699d00>, <matplotlib.lines.Line2D object at 0x7fea3569a450>, <matplotlib.lines.Line2D object at 0x7fea35698aa0>, <matplotlib.lines.Line2D object at 0x7fea35699dc0>, <matplotlib.lines.Line2D object at 0x7fea3569a990>, <matplotlib.lines.Line2D object at 0x7fea356994f0>, <matplotlib.lines.Line2D object at 0x7fea35698fb0>, <matplotlib.lines.Line2D object at 0x7fea35698c80>, <matplotlib.lines.Line2D object at 0x7fea356995e0>, <matplotlib.lines.Line2D object at 0x7fea35698ec0>, <matplotlib.lines.Line2D object at 0x7fea3569bd10>, <matplotlib.lines.Line2D object at 0x7fea358ac3b0>, <matplotlib.lines.Line2D object at 0x7fea358ac110>, <matplotlib.lines.Line2D object at 0x7fea358acfb0>, <matplotlib.legend.Legend object at 0x7fea34367950>]
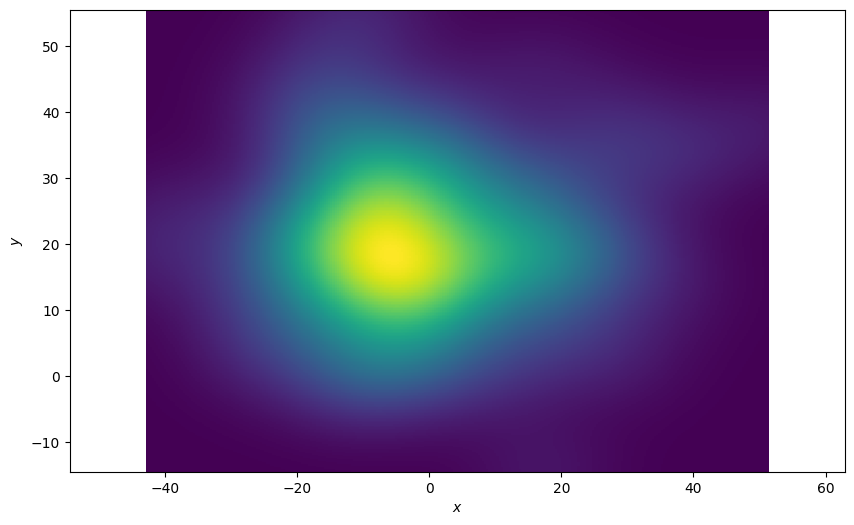
Density Plot of All States
Plot a 2D density plot for all the states in the ground truths. This is a better visualisation because we can see a clear concentration of states around the origin where all the tracks start.
plotter = Plotter()
plotter.plot_density(truths, index=None)

Plot of the Last State of the Ground Truths
The function allows you to pick an index of the state sequence (ground truth in this example) to plot. In this example we’re only interested in the final state of the sequences. An index of ‘-1’ is the last state in the sequence. The resultant plot is much more spread out.
plotter = Plotter()
plotter.plot_density(truths, index=-1)
Plot each state over time
Plot the density at each time-step and see how the density plot evolves. Define an animation update function.
def update(i):
    plotter.ax.clear()
    plotter.plot_density(truths, index=i)
    return plotter.ax
Finally, plot the densities over time.
plotter = Plotter()
animation.FuncAnimation(plotter.fig, update, frames=range(1, n_time_steps))
Total running time of the script: (0 minutes 20.206 seconds)