Note
Go to the end to download the full example code or to run this example in your browser via Binder
Density Plot Example
This example looks at how to plot 2d density plots. The Plotter().plot_density function can be
used to plot any number of StateMutableSequence objects. StateMutableSequences are just a
container for a number of states, examples include tracks and ground truth paths. The examples
below show how to plot ground truth paths (as they’re easy to generate). The function can be used to
analyse large data sets.
Set the imports and set the start time
from datetime import datetime, timedelta
from matplotlib import animation

from stonesoup.types.groundtruth import GroundTruthPath, GroundTruthState
from stonesoup.models.transition.linear import CombinedLinearGaussianTransitionModel, \
                                               ConstantVelocity
from stonesoup.plotter import Plotter

start_time = datetime.now()
Generate the State Sequences to Plot
In these examples we’re going plot ground-truth as that is the easiest to generate. An simple function has been created to ground truth
def generate_ground_truth_path(initial_state, num_steps=20, motion_model_noise=0.01):

    transition_model = CombinedLinearGaussianTransitionModel(
        [ConstantVelocity(motion_model_noise), ConstantVelocity(motion_model_noise)])

    ground_truth = GroundTruthPath([GroundTruthState(initial_state, timestamp=start_time)])

    for k in range(0, num_steps):
        ground_truth.append(GroundTruthState(
            transition_model.function(ground_truth[k], noise=True,
                                      time_interval=timedelta(seconds=1)),
            timestamp=start_time+timedelta(seconds=k+1)))

    return ground_truth
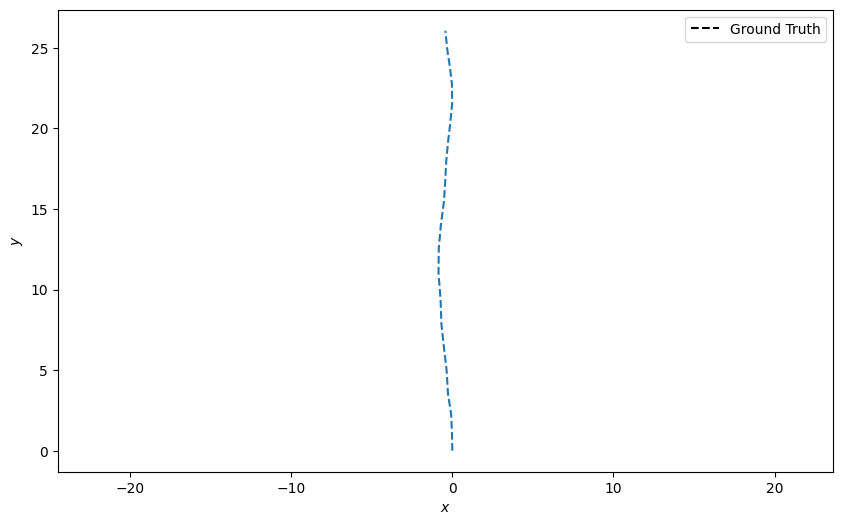
Create one ground truth path starting at the origin (0,0) and plot it
n_time_steps = 20
truth = generate_ground_truth_path(initial_state=[0, 0, 0, 1], num_steps=n_time_steps)

plotter = Plotter()
plotter.plot_ground_truths(truth, [0, 2])
[<matplotlib.lines.Line2D object at 0x7fbdeef23250>, <matplotlib.legend.Legend object at 0x7fbdef9c50d0>]
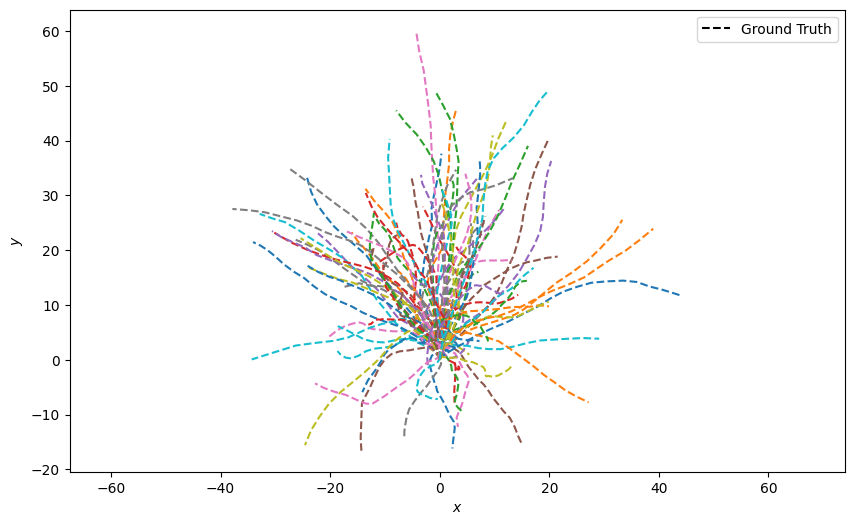
Generate 100 ground truth paths and plot them all at once. This looks quite messy
truths = [generate_ground_truth_path(initial_state=[0, 0, 0, 1],
                                     num_steps=n_time_steps,
                                     motion_model_noise=0.1)
          for _ in range(100)]

plotter = Plotter()
plotter.plot_ground_truths(set(truths), [0, 2])
[<matplotlib.lines.Line2D object at 0x7fbdeed98e10>, <matplotlib.lines.Line2D object at 0x7fbdeebe1410>, <matplotlib.lines.Line2D object at 0x7fbdeebe2c90>, <matplotlib.lines.Line2D object at 0x7fbdeebe3c50>, <matplotlib.lines.Line2D object at 0x7fbdeebe1a50>, <matplotlib.lines.Line2D object at 0x7fbdeebe2cd0>, <matplotlib.lines.Line2D object at 0x7fbdeea0c3d0>, <matplotlib.lines.Line2D object at 0x7fbdeea0d650>, <matplotlib.lines.Line2D object at 0x7fbdeebe1950>, <matplotlib.lines.Line2D object at 0x7fbdeea0d750>, <matplotlib.lines.Line2D object at 0x7fbdeebfde10>, <matplotlib.lines.Line2D object at 0x7fbdeebfeb10>, <matplotlib.lines.Line2D object at 0x7fbdeebff790>, <matplotlib.lines.Line2D object at 0x7fbdeebfdc50>, <matplotlib.lines.Line2D object at 0x7fbdeea19410>, <matplotlib.lines.Line2D object at 0x7fbdeea1a690>, <matplotlib.lines.Line2D object at 0x7fbdeea1b850>, <matplotlib.lines.Line2D object at 0x7fbdeea1a610>, <matplotlib.lines.Line2D object at 0x7fbdeea1a450>, <matplotlib.lines.Line2D object at 0x7fbdeea1ba50>, <matplotlib.lines.Line2D object at 0x7fbdeea24f50>, <matplotlib.lines.Line2D object at 0x7fbdeef8df50>, <matplotlib.lines.Line2D object at 0x7fbdeea0c110>, <matplotlib.lines.Line2D object at 0x7fbdf221d690>, <matplotlib.lines.Line2D object at 0x7fbdeea1b650>, <matplotlib.lines.Line2D object at 0x7fbdeec61bd0>, <matplotlib.lines.Line2D object at 0x7fbdeec61990>, <matplotlib.lines.Line2D object at 0x7fbdeec62450>, <matplotlib.lines.Line2D object at 0x7fbdeec62d50>, <matplotlib.lines.Line2D object at 0x7fbdf1917cd0>, <matplotlib.lines.Line2D object at 0x7fbdeeba9890>, <matplotlib.lines.Line2D object at 0x7fbdef0627d0>, <matplotlib.lines.Line2D object at 0x7fbdef062ad0>, <matplotlib.lines.Line2D object at 0x7fbdeebe1750>, <matplotlib.lines.Line2D object at 0x7fbdf03425d0>, <matplotlib.lines.Line2D object at 0x7fbdeea36890>, <matplotlib.lines.Line2D object at 0x7fbdeea37650>, <matplotlib.lines.Line2D object at 0x7fbdeea34590>, <matplotlib.lines.Line2D object at 0x7fbdeebd6650>, <matplotlib.lines.Line2D object at 0x7fbdeebd76d0>, <matplotlib.lines.Line2D object at 0x7fbdeebd4710>, <matplotlib.lines.Line2D object at 0x7fbded7fd950>, <matplotlib.lines.Line2D object at 0x7fbdeec09cd0>, <matplotlib.lines.Line2D object at 0x7fbdeed5c790>, <matplotlib.lines.Line2D object at 0x7fbdef060c50>, <matplotlib.lines.Line2D object at 0x7fbdf23591d0>, <matplotlib.lines.Line2D object at 0x7fbdee74cb90>, <matplotlib.lines.Line2D object at 0x7fbdef5a9a50>, <matplotlib.lines.Line2D object at 0x7fbdee74e350>, <matplotlib.lines.Line2D object at 0x7fbdee74f0d0>, <matplotlib.lines.Line2D object at 0x7fbdee74e790>, <matplotlib.lines.Line2D object at 0x7fbdee74cdd0>, <matplotlib.lines.Line2D object at 0x7fbdee74f2d0>, <matplotlib.lines.Line2D object at 0x7fbdee76ca90>, <matplotlib.lines.Line2D object at 0x7fbdee76db10>, <matplotlib.lines.Line2D object at 0x7fbdee76e710>, <matplotlib.lines.Line2D object at 0x7fbdee76f490>, <matplotlib.lines.Line2D object at 0x7fbdee76c3d0>, <matplotlib.lines.Line2D object at 0x7fbdee76fbd0>, <matplotlib.lines.Line2D object at 0x7fbdee75c550>, <matplotlib.lines.Line2D object at 0x7fbdee75f9d0>, <matplotlib.lines.Line2D object at 0x7fbdee75e790>, <matplotlib.lines.Line2D object at 0x7fbdee75ce10>, <matplotlib.lines.Line2D object at 0x7fbdeea51490>, <matplotlib.lines.Line2D object at 0x7fbdf8265f10>, <matplotlib.lines.Line2D object at 0x7fbdeea1b690>, <matplotlib.lines.Line2D object at 0x7fbdeea505d0>, <matplotlib.lines.Line2D object at 0x7fbdeea516d0>, <matplotlib.lines.Line2D object at 0x7fbdeea528d0>, <matplotlib.lines.Line2D object at 0x7fbdee7844d0>, <matplotlib.lines.Line2D object at 0x7fbdee785650>, <matplotlib.lines.Line2D object at 0x7fbdee785d10>, <matplotlib.lines.Line2D object at 0x7fbdee784990>, <matplotlib.lines.Line2D object at 0x7fbdee785f10>, <matplotlib.lines.Line2D object at 0x7fbded260b10>, <matplotlib.lines.Line2D object at 0x7fbdee77b2d0>, <matplotlib.lines.Line2D object at 0x7fbdef060950>, <matplotlib.lines.Line2D object at 0x7fbdeeb1f750>, <matplotlib.lines.Line2D object at 0x7fbdee796290>, <matplotlib.lines.Line2D object at 0x7fbdee796ad0>, <matplotlib.lines.Line2D object at 0x7fbdee7976d0>, <matplotlib.lines.Line2D object at 0x7fbdee794090>, <matplotlib.lines.Line2D object at 0x7fbdf2057c50>, <matplotlib.lines.Line2D object at 0x7fbdeeb1e310>, <matplotlib.lines.Line2D object at 0x7fbdee7cc490>, <matplotlib.lines.Line2D object at 0x7fbdf221c9d0>, <matplotlib.lines.Line2D object at 0x7fbdee7a5950>, <matplotlib.lines.Line2D object at 0x7fbdee7a6890>, <matplotlib.lines.Line2D object at 0x7fbdee7a4110>, <matplotlib.lines.Line2D object at 0x7fbdee7a5690>, <matplotlib.lines.Line2D object at 0x7fbdee7a6710>, <matplotlib.lines.Line2D object at 0x7fbdee7a7990>, <matplotlib.lines.Line2D object at 0x7fbdee74cc50>, <matplotlib.lines.Line2D object at 0x7fbdee7bdb90>, <matplotlib.lines.Line2D object at 0x7fbdee7bead0>, <matplotlib.lines.Line2D object at 0x7fbdee7bfad0>, <matplotlib.lines.Line2D object at 0x7fbdee7bc510>, <matplotlib.lines.Line2D object at 0x7fbdee7bd810>, <matplotlib.lines.Line2D object at 0x7fbdee7bf110>, <matplotlib.lines.Line2D object at 0x7fbdee74efd0>, <matplotlib.legend.Legend object at 0x7fbdef78dd10>]
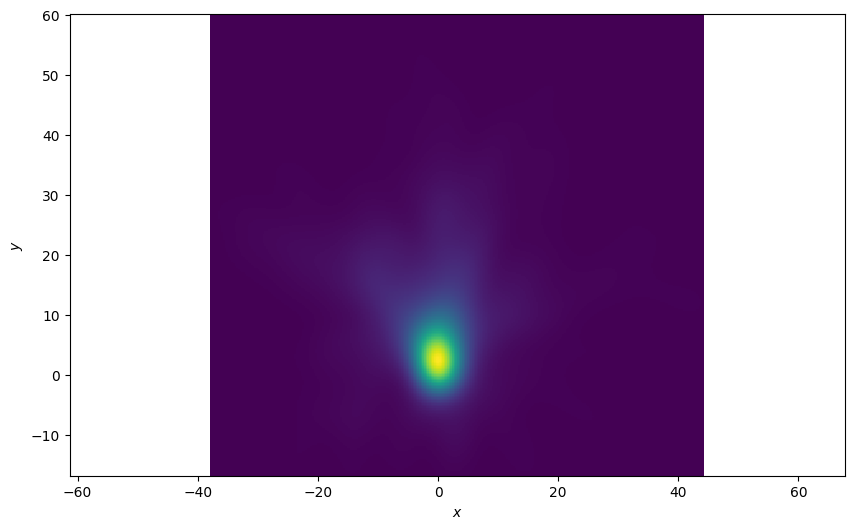
Density Plot of All States
Plot a 2d density plot for all the states in the ground-truth. This is clearer, we can see a clear concentration around the origin where all the tracks start
plotter = Plotter()
plotter.plot_density(truths, index=None)
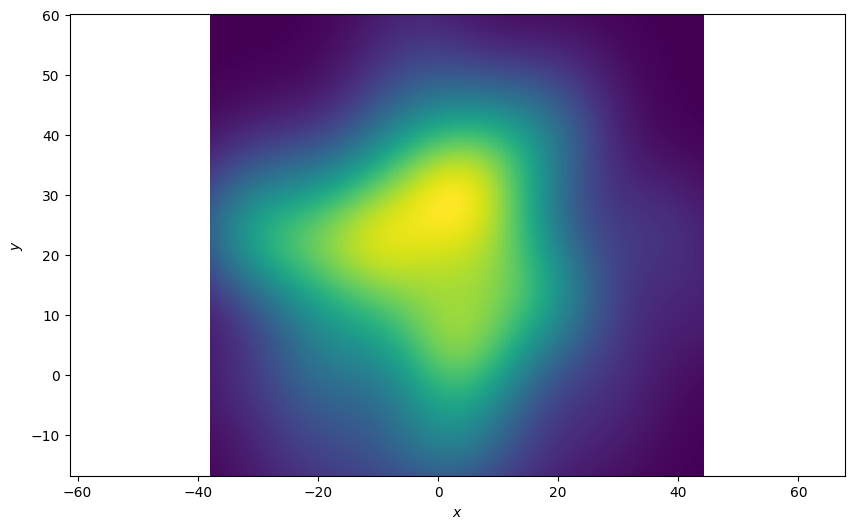
Plot of the Last State of the Ground Truths
The function allows you to pick an index of the state sequence (ground truth in this example) to plot. In this example we’re only interested in the final state of the sequences. An index of ‘-1’ is the last state in the sequence. The resultant plot is much more spread out
plotter = Plotter()
plotter.plot_density(truths, index=-1)
Plot each state over time
Plot the density at each time-step and see how the density plot evolves. Define an animation update function.
def update(i):
    plotter.ax.clear()
    plotter.plot_density(truths, index=i)
    return plotter.ax
Plot the densities over time.
plotter = Plotter()
animation.FuncAnimation(plotter.fig, update, frames=range(1, n_time_steps))
Total running time of the script: (0 minutes 22.496 seconds)