Note
Click here to download the full example code or to run this example in your browser via Binder
Density Plot Example
This example looks at how to plot 2d density plots. The Plotter().plot_density function can be
used to plot any number of StateMutableSequence objects. StateMutableSequences are just a
container for a number of states, examples include tracks and ground truth paths. The examples
below show how to plot ground truth paths (as they’re easy to generate). The function can be used to
analyse large data sets.
Set the imports and set the start time
from datetime import datetime, timedelta
from matplotlib import animation

from stonesoup.types.groundtruth import GroundTruthPath, GroundTruthState
from stonesoup.models.transition.linear import CombinedLinearGaussianTransitionModel, \
                                               ConstantVelocity
from stonesoup.plotter import Plotter

start_time = datetime.now()
Generate the State Sequences to Plot
In these examples we’re going plot ground-truth as that is the easiest to generate. An simple function has been created to ground truth
def generate_ground_truth_path(initial_state, num_steps=20, motion_model_noise=0.01):

    transition_model = CombinedLinearGaussianTransitionModel(
        [ConstantVelocity(motion_model_noise), ConstantVelocity(motion_model_noise)])

    ground_truth = GroundTruthPath([GroundTruthState(initial_state, timestamp=start_time)])

    for k in range(0, num_steps):
        ground_truth.append(GroundTruthState(
            transition_model.function(ground_truth[k], noise=True,
                                      time_interval=timedelta(seconds=1)),
            timestamp=start_time+timedelta(seconds=k+1)))

    return ground_truth
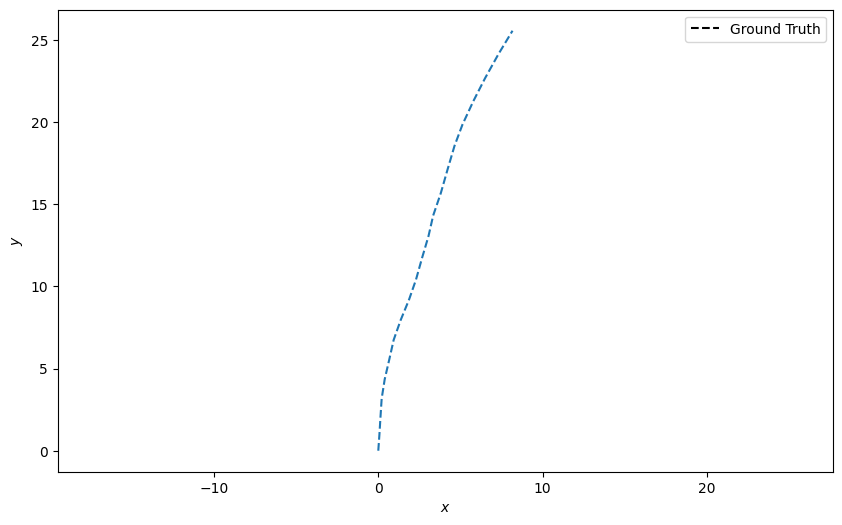
Create one ground truth path starting at the origin (0,0) and plot it
n_time_steps = 20
truth = generate_ground_truth_path(initial_state=[0, 0, 0, 1], num_steps=n_time_steps)

plotter = Plotter()
plotter.plot_ground_truths(truth, [0, 2])
[<matplotlib.lines.Line2D object at 0x7f7b2c3d3f90>, <matplotlib.legend.Legend object at 0x7f7b2c3e7390>]
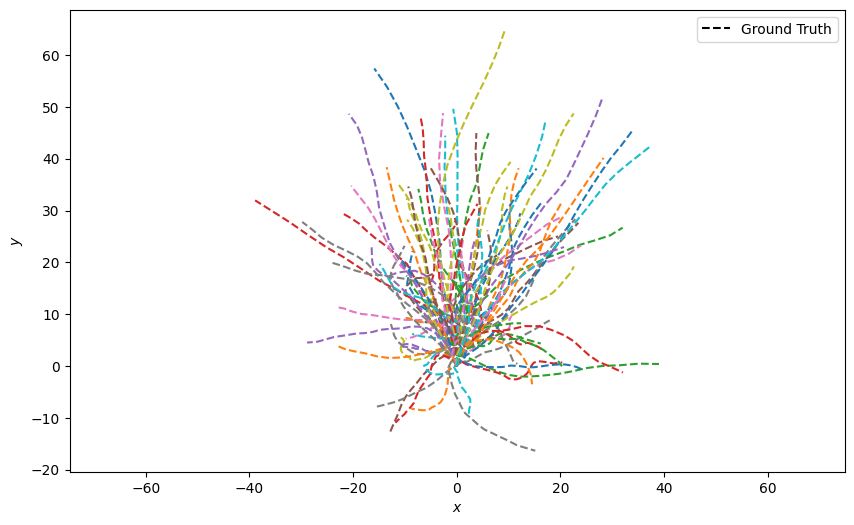
Generate 100 ground truth paths and plot them all at once. This looks quite messy
truths = [generate_ground_truth_path(initial_state=[0, 0, 0, 1],
                                     num_steps=n_time_steps,
                                     motion_model_noise=0.1)
          for _ in range(100)]

plotter = Plotter()
plotter.plot_ground_truths(set(truths), [0, 2])
[<matplotlib.lines.Line2D object at 0x7f7b2f32f590>, <matplotlib.lines.Line2D object at 0x7f7b2c390fd0>, <matplotlib.lines.Line2D object at 0x7f7b2c470990>, <matplotlib.lines.Line2D object at 0x7f7b2c471310>, <matplotlib.lines.Line2D object at 0x7f7b2c471ad0>, <matplotlib.lines.Line2D object at 0x7f7b2c472410>, <matplotlib.lines.Line2D object at 0x7f7b2c472d10>, <matplotlib.lines.Line2D object at 0x7f7b2c472e50>, <matplotlib.lines.Line2D object at 0x7f7b2c471210>, <matplotlib.lines.Line2D object at 0x7f7b2c4786d0>, <matplotlib.lines.Line2D object at 0x7f7b2c478f50>, <matplotlib.lines.Line2D object at 0x7f7b2c479850>, <matplotlib.lines.Line2D object at 0x7f7b2c47a050>, <matplotlib.lines.Line2D object at 0x7f7b2c47a990>, <matplotlib.lines.Line2D object at 0x7f7b2c47b250>, <matplotlib.lines.Line2D object at 0x7f7b2c47ba50>, <matplotlib.lines.Line2D object at 0x7f7b2c484450>, <matplotlib.lines.Line2D object at 0x7f7b2c484c50>, <matplotlib.lines.Line2D object at 0x7f7b2c484cd0>, <matplotlib.lines.Line2D object at 0x7f7b2c485d50>, <matplotlib.lines.Line2D object at 0x7f7b2c486690>, <matplotlib.lines.Line2D object at 0x7f7b2c5c6ed0>, <matplotlib.lines.Line2D object at 0x7f7b2c487710>, <matplotlib.lines.Line2D object at 0x7f7b2c45c810>, <matplotlib.lines.Line2D object at 0x7f7b2c408950>, <matplotlib.lines.Line2D object at 0x7f7b2c291210>, <matplotlib.lines.Line2D object at 0x7f7b2c45d6d0>, <matplotlib.lines.Line2D object at 0x7f7b2c39b0d0>, <matplotlib.lines.Line2D object at 0x7f7b2c292a50>, <matplotlib.lines.Line2D object at 0x7f7b2c3af150>, <matplotlib.lines.Line2D object at 0x7f7b301bb210>, <matplotlib.lines.Line2D object at 0x7f7b327f8490>, <matplotlib.lines.Line2D object at 0x7f7b2c684d90>, <matplotlib.lines.Line2D object at 0x7f7b2cba1510>, <matplotlib.lines.Line2D object at 0x7f7b2c299d10>, <matplotlib.lines.Line2D object at 0x7f7b2c29a690>, <matplotlib.lines.Line2D object at 0x7f7b2ca2aed0>, <matplotlib.lines.Line2D object at 0x7f7b2c29ae10>, <matplotlib.lines.Line2D object at 0x7f7b2c473e50>, <matplotlib.lines.Line2D object at 0x7f7b2ca2c6d0>, <matplotlib.lines.Line2D object at 0x7f7b2c2a4ed0>, <matplotlib.lines.Line2D object at 0x7f7b2cd857d0>, <matplotlib.lines.Line2D object at 0x7f7b2c2a6110>, <matplotlib.lines.Line2D object at 0x7f7b2c409bd0>, <matplotlib.lines.Line2D object at 0x7f7b2c2a68d0>, <matplotlib.lines.Line2D object at 0x7f7b2c2a79d0>, <matplotlib.lines.Line2D object at 0x7f7b2c6a3350>, <matplotlib.lines.Line2D object at 0x7f7b2c2b4b90>, <matplotlib.lines.Line2D object at 0x7f7b2c2b4ad0>, <matplotlib.lines.Line2D object at 0x7f7b2c637ad0>, <matplotlib.lines.Line2D object at 0x7f7b2c478750>, <matplotlib.lines.Line2D object at 0x7f7b2c720950>, <matplotlib.lines.Line2D object at 0x7f7b2c2b7510>, <matplotlib.lines.Line2D object at 0x7f7b2c4729d0>, <matplotlib.lines.Line2D object at 0x7f7b2ca28610>, <matplotlib.lines.Line2D object at 0x7f7b2c2c0dd0>, <matplotlib.lines.Line2D object at 0x7f7b2ca29710>, <matplotlib.lines.Line2D object at 0x7f7b2c485890>, <matplotlib.lines.Line2D object at 0x7f7b2c486110>, <matplotlib.lines.Line2D object at 0x7f7b2c2c2f10>, <matplotlib.lines.Line2D object at 0x7f7b2c473d90>, <matplotlib.lines.Line2D object at 0x7f7b2c2cc190>, <matplotlib.lines.Line2D object at 0x7f7b2c2b7290>, <matplotlib.lines.Line2D object at 0x7f7b2c2cd250>, <matplotlib.lines.Line2D object at 0x7f7b2c2cdb10>, <matplotlib.lines.Line2D object at 0x7f7b2c2cda10>, <matplotlib.lines.Line2D object at 0x7f7b2c2cec50>, <matplotlib.lines.Line2D object at 0x7f7b2c5af4d0>, <matplotlib.lines.Line2D object at 0x7f7b2c2cfc50>, <matplotlib.lines.Line2D object at 0x7f7b2c3af6d0>, <matplotlib.lines.Line2D object at 0x7f7b2c2d8d10>, <matplotlib.lines.Line2D object at 0x7f7b2c2a52d0>, <matplotlib.lines.Line2D object at 0x7f7b2c2d9e50>, <matplotlib.lines.Line2D object at 0x7f7b2c3f7a90>, <matplotlib.lines.Line2D object at 0x7f7b2c2dafd0>, <matplotlib.lines.Line2D object at 0x7f7b2c2db750>, <matplotlib.lines.Line2D object at 0x7f7b2c2dbf90>, <matplotlib.lines.Line2D object at 0x7f7b2c738850>, <matplotlib.lines.Line2D object at 0x7f7b2c2b57d0>, <matplotlib.lines.Line2D object at 0x7f7b2c461990>, <matplotlib.lines.Line2D object at 0x7f7b2c2e2290>, <matplotlib.lines.Line2D object at 0x7f7b2c292ad0>, <matplotlib.lines.Line2D object at 0x7f7b2c2e32d0>, <matplotlib.lines.Line2D object at 0x7f7b2c293b50>, <matplotlib.lines.Line2D object at 0x7f7b2c2b4350>, <matplotlib.lines.Line2D object at 0x7f7b2c2ecbd0>, <matplotlib.lines.Line2D object at 0x7f7b2ca24050>, <matplotlib.lines.Line2D object at 0x7f7b2c2edb90>, <matplotlib.lines.Line2D object at 0x7f7b300763d0>, <matplotlib.lines.Line2D object at 0x7f7b2c2eeb50>, <matplotlib.lines.Line2D object at 0x7f7b2c6073d0>, <matplotlib.lines.Line2D object at 0x7f7b2c2efcd0>, <matplotlib.lines.Line2D object at 0x7f7b2c5e6310>, <matplotlib.lines.Line2D object at 0x7f7b2c2f8dd0>, <matplotlib.lines.Line2D object at 0x7f7b2c2d9610>, <matplotlib.lines.Line2D object at 0x7f7b2c2f9e10>, <matplotlib.lines.Line2D object at 0x7f7b2df2a6d0>, <matplotlib.lines.Line2D object at 0x7f7b2c2fae50>, <matplotlib.lines.Line2D object at 0x7f7b2c29b650>, <matplotlib.lines.Line2D object at 0x7f7b2c29be50>, <matplotlib.legend.Legend object at 0x7f7b2e016890>]
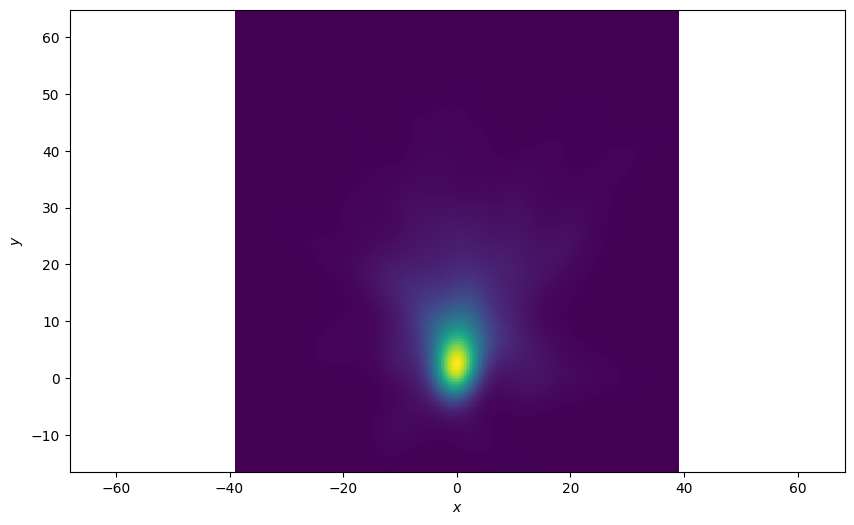
Density Plot of All States
Plot a 2d density plot for all the states in the ground-truth. This is clearer, we can see a clear concentration around the origin where all the tracks start
plotter = Plotter()
plotter.plot_density(truths, index=None)
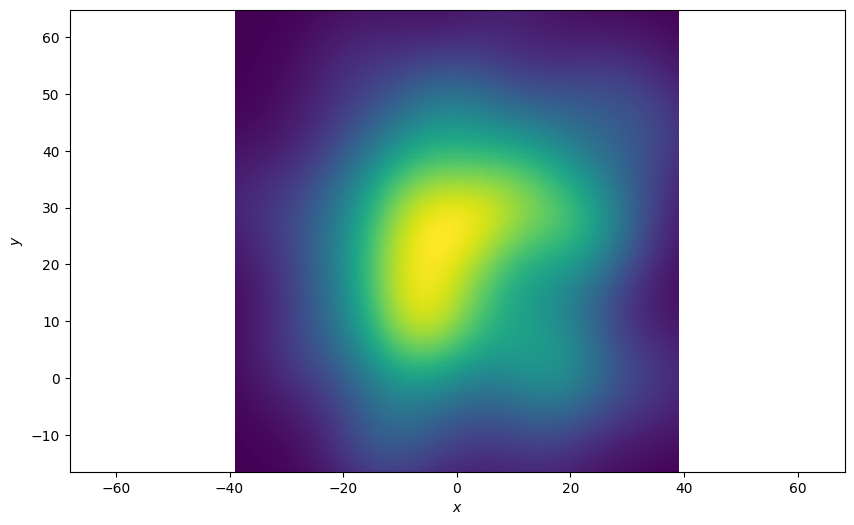
Plot of the Last State of the Ground Truths
The function allows you to pick an index of the state sequence (ground truth in this example) to plot. In this example we’re only interested in the final state of the sequences. An index of ‘-1’ is the last state in the sequence. The resultant plot is much more spread out
plotter = Plotter()
plotter.plot_density(truths, index=-1)
Plot each state over time
Plot the density at each time-step and see how the density plot evolves. Define an animation update function.
def update(i):
    plotter.ax.clear()
    plotter.plot_density(truths, index=i)
    return plotter.ax
Plot the densities over time.
plotter = Plotter()
animation.FuncAnimation(plotter.fig, update, frames=range(1, n_time_steps))
Total running time of the script: ( 0 minutes 22.576 seconds)