Note
Go to the end to download the full example code or to run this example in your browser via Binder
Density Plot Example
This example looks at how to plot 2d density plots. The Plotter().plot_density function can be
used to plot any number of StateMutableSequence objects. StateMutableSequences are just a
container for a number of states - examples include tracks and ground truth paths. The examples
below show how to plot ground truth paths (as they’re easy to generate). The function can be used to
analyse large data sets.
Set the imports and set the start time
from datetime import datetime, timedelta
from matplotlib import animation

from stonesoup.types.groundtruth import GroundTruthPath, GroundTruthState
from stonesoup.models.transition.linear import CombinedLinearGaussianTransitionModel, \
                                               ConstantVelocity
from stonesoup.plotter import Plotter

start_time = datetime.now()
Generate the State Sequences to Plot
In this example we will plot ground truth paths due to their ease of creation. The ground truths are created in the following function:
def generate_ground_truth_path(initial_state, num_steps=20, motion_model_noise=0.01):

    transition_model = CombinedLinearGaussianTransitionModel(
        [ConstantVelocity(motion_model_noise), ConstantVelocity(motion_model_noise)])

    ground_truth = GroundTruthPath([GroundTruthState(initial_state, timestamp=start_time)])

    for k in range(0, num_steps):
        ground_truth.append(GroundTruthState(
            transition_model.function(ground_truth[k], noise=True,
                                      time_interval=timedelta(seconds=1)),
            timestamp=start_time+timedelta(seconds=k+1)))

    return ground_truth
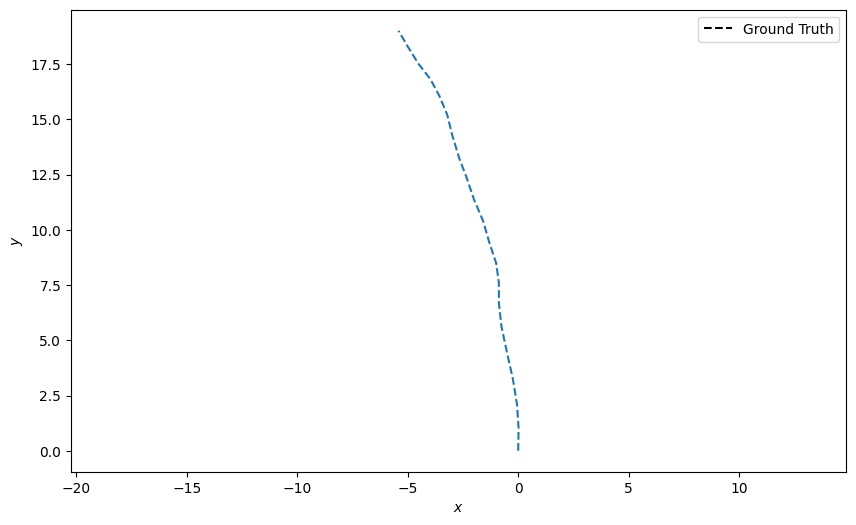
Create one ground truth path starting at the origin (0, 0) and plot it:
n_time_steps = 20
truth = generate_ground_truth_path(initial_state=[0, 0, 0, 1], num_steps=n_time_steps)

plotter = Plotter()
plotter.plot_ground_truths(truth, [0, 2])
[<matplotlib.lines.Line2D object at 0x7fa9f0535c70>, <matplotlib.legend.Legend object at 0x7fa9f02ee9c0>]
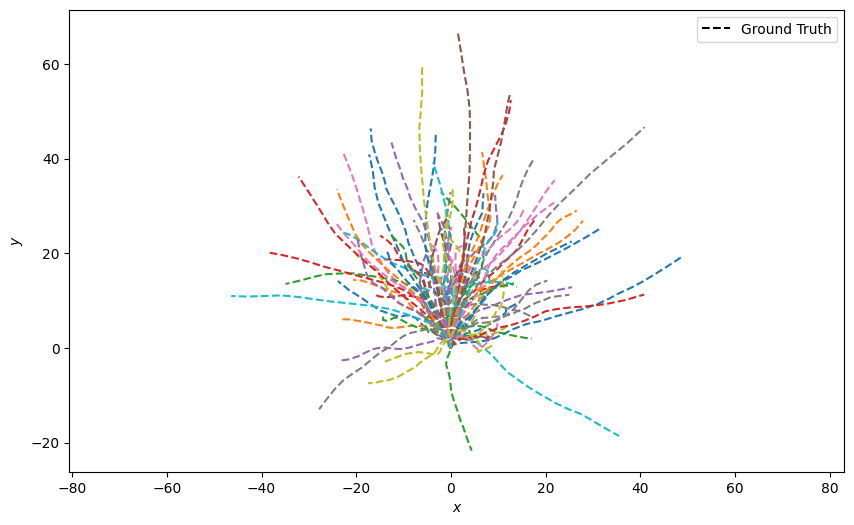
Generate 100 ground truth paths and plot them all at once. This looks quite messy:
truths = [generate_ground_truth_path(initial_state=[0, 0, 0, 1],
                                     num_steps=n_time_steps,
                                     motion_model_noise=0.1)
          for _ in range(100)]

plotter = Plotter()
plotter.plot_ground_truths(set(truths), [0, 2])
[<matplotlib.lines.Line2D object at 0x7fa9e75d0ef0>, <matplotlib.lines.Line2D object at 0x7fa9e76da090>, <matplotlib.lines.Line2D object at 0x7fa9e76da360>, <matplotlib.lines.Line2D object at 0x7fa9e76da690>, <matplotlib.lines.Line2D object at 0x7fa9e76da840>, <matplotlib.lines.Line2D object at 0x7fa9e76daa50>, <matplotlib.lines.Line2D object at 0x7fa9e76dae10>, <matplotlib.lines.Line2D object at 0x7fa9e6860ec0>, <matplotlib.lines.Line2D object at 0x7fa9e68627b0>, <matplotlib.lines.Line2D object at 0x7fa9e694bb30>, <matplotlib.lines.Line2D object at 0x7fa9e6eaa0f0>, <matplotlib.lines.Line2D object at 0x7fa9e6d065a0>, <matplotlib.lines.Line2D object at 0x7fa9e69a6300>, <matplotlib.lines.Line2D object at 0x7fa9e6aea8a0>, <matplotlib.lines.Line2D object at 0x7fa9e687c6b0>, <matplotlib.lines.Line2D object at 0x7fa9e687c650>, <matplotlib.lines.Line2D object at 0x7fa9e6844920>, <matplotlib.lines.Line2D object at 0x7fa9e6cf80e0>, <matplotlib.lines.Line2D object at 0x7fa9e6758620>, <matplotlib.lines.Line2D object at 0x7fa9e6758d10>, <matplotlib.lines.Line2D object at 0x7fa9e675ac90>, <matplotlib.lines.Line2D object at 0x7fa9e6759490>, <matplotlib.lines.Line2D object at 0x7fa9e675a5a0>, <matplotlib.lines.Line2D object at 0x7fa9e67582c0>, <matplotlib.lines.Line2D object at 0x7fa9e6758d40>, <matplotlib.lines.Line2D object at 0x7fa9e6759670>, <matplotlib.lines.Line2D object at 0x7fa9e6759e50>, <matplotlib.lines.Line2D object at 0x7fa9e675a870>, <matplotlib.lines.Line2D object at 0x7fa9e675b050>, <matplotlib.lines.Line2D object at 0x7fa9e675bce0>, <matplotlib.lines.Line2D object at 0x7fa9e68bc770>, <matplotlib.lines.Line2D object at 0x7fa9e68bd1c0>, <matplotlib.lines.Line2D object at 0x7fa9e68fa000>, <matplotlib.lines.Line2D object at 0x7fa9e68f8cb0>, <matplotlib.lines.Line2D object at 0x7fa9e68f90d0>, <matplotlib.lines.Line2D object at 0x7fa9e671dfd0>, <matplotlib.lines.Line2D object at 0x7fa9e671c6e0>, <matplotlib.lines.Line2D object at 0x7fa9e671c1a0>, <matplotlib.lines.Line2D object at 0x7fa9e671eb10>, <matplotlib.lines.Line2D object at 0x7fa9e671e330>, <matplotlib.lines.Line2D object at 0x7fa9e689e030>, <matplotlib.lines.Line2D object at 0x7fa9e689f950>, <matplotlib.lines.Line2D object at 0x7fa9e67b4230>, <matplotlib.lines.Line2D object at 0x7fa9e67b6d50>, <matplotlib.lines.Line2D object at 0x7fa9e67b6540>, <matplotlib.lines.Line2D object at 0x7fa9e67b7980>, <matplotlib.lines.Line2D object at 0x7fa9e67b5250>, <matplotlib.lines.Line2D object at 0x7fa9e67b50d0>, <matplotlib.lines.Line2D object at 0x7fa9e67b5f40>, <matplotlib.lines.Line2D object at 0x7fa9e67b7bc0>, <matplotlib.lines.Line2D object at 0x7fa9e67b7d40>, <matplotlib.lines.Line2D object at 0x7fa9e67b45c0>, <matplotlib.lines.Line2D object at 0x7fa9e67b4d70>, <matplotlib.lines.Line2D object at 0x7fa9e67b52b0>, <matplotlib.lines.Line2D object at 0x7fa9e67b57c0>, <matplotlib.lines.Line2D object at 0x7fa9e67b5d90>, <matplotlib.lines.Line2D object at 0x7fa9e67b64b0>, <matplotlib.lines.Line2D object at 0x7fa9e67b6b10>, <matplotlib.lines.Line2D object at 0x7fa9e67b70e0>, <matplotlib.lines.Line2D object at 0x7fa9e67b7740>, <matplotlib.lines.Line2D object at 0x7fa9e67b7cb0>, <matplotlib.lines.Line2D object at 0x7fa9e6739c10>, <matplotlib.lines.Line2D object at 0x7fa9e6739970>, <matplotlib.lines.Line2D object at 0x7fa9e6739550>, <matplotlib.lines.Line2D object at 0x7fa9e673b470>, <matplotlib.lines.Line2D object at 0x7fa9e673b8c0>, <matplotlib.lines.Line2D object at 0x7fa9e6738080>, <matplotlib.lines.Line2D object at 0x7fa9e6820ce0>, <matplotlib.lines.Line2D object at 0x7fa9e67f4500>, <matplotlib.lines.Line2D object at 0x7fa9e67f4c80>, <matplotlib.lines.Line2D object at 0x7fa9e67f5310>, <matplotlib.lines.Line2D object at 0x7fa9e67f5370>, <matplotlib.lines.Line2D object at 0x7fa9e67f4e30>, <matplotlib.lines.Line2D object at 0x7fa9e67f59a0>, <matplotlib.lines.Line2D object at 0x7fa9e67f5220>, <matplotlib.lines.Line2D object at 0x7fa9e67f5ee0>, <matplotlib.lines.Line2D object at 0x7fa9e67f6b70>, <matplotlib.lines.Line2D object at 0x7fa9e67f6f90>, <matplotlib.lines.Line2D object at 0x7fa9e67f6390>, <matplotlib.lines.Line2D object at 0x7fa9e67f7f50>, <matplotlib.lines.Line2D object at 0x7fa9f1f2a4e0>, <matplotlib.lines.Line2D object at 0x7fa9e60c6d20>, <matplotlib.lines.Line2D object at 0x7fa9e60c5af0>, <matplotlib.lines.Line2D object at 0x7fa9e60c5790>, <matplotlib.lines.Line2D object at 0x7fa9e60c5d00>, <matplotlib.lines.Line2D object at 0x7fa9e60c4650>, <matplotlib.lines.Line2D object at 0x7fa9e60c5c10>, <matplotlib.lines.Line2D object at 0x7fa9e60c4350>, <matplotlib.lines.Line2D object at 0x7fa9e60c4ad0>, <matplotlib.lines.Line2D object at 0x7fa9e60c4d10>, <matplotlib.lines.Line2D object at 0x7fa9e60c5550>, <matplotlib.lines.Line2D object at 0x7fa9e60c5970>, <matplotlib.lines.Line2D object at 0x7fa9e60c5a60>, <matplotlib.lines.Line2D object at 0x7fa9e60c4fe0>, <matplotlib.lines.Line2D object at 0x7fa9e60c41a0>, <matplotlib.lines.Line2D object at 0x7fa9e60c63f0>, <matplotlib.lines.Line2D object at 0x7fa9e60c6780>, <matplotlib.lines.Line2D object at 0x7fa9e60c60f0>, <matplotlib.lines.Line2D object at 0x7fa9e60c7560>, <matplotlib.lines.Line2D object at 0x7fa9e60c40b0>, <matplotlib.legend.Legend object at 0x7fa9e75d27b0>]
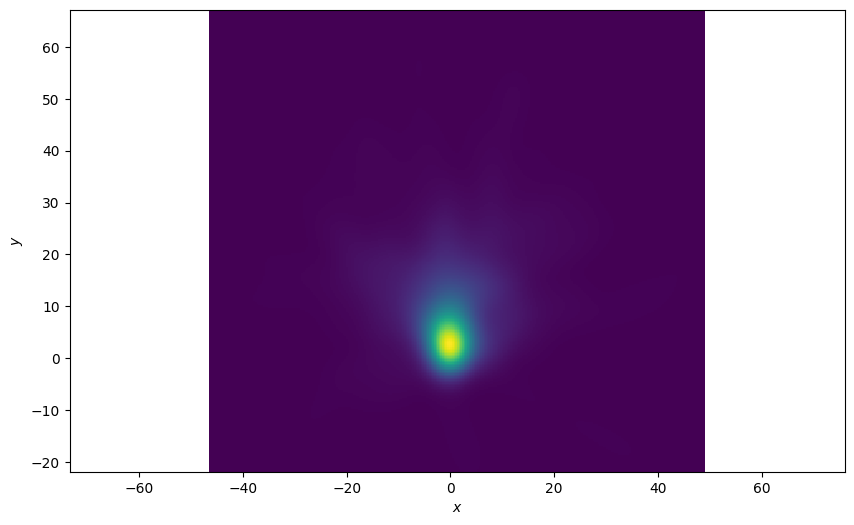
Density Plot of All States
Plot a 2D density plot for all the states in the ground truths. This is a better visualisation because we can see a clear concentration of states around the origin where all the tracks start.
plotter = Plotter()
plotter.plot_density(truths, index=None)
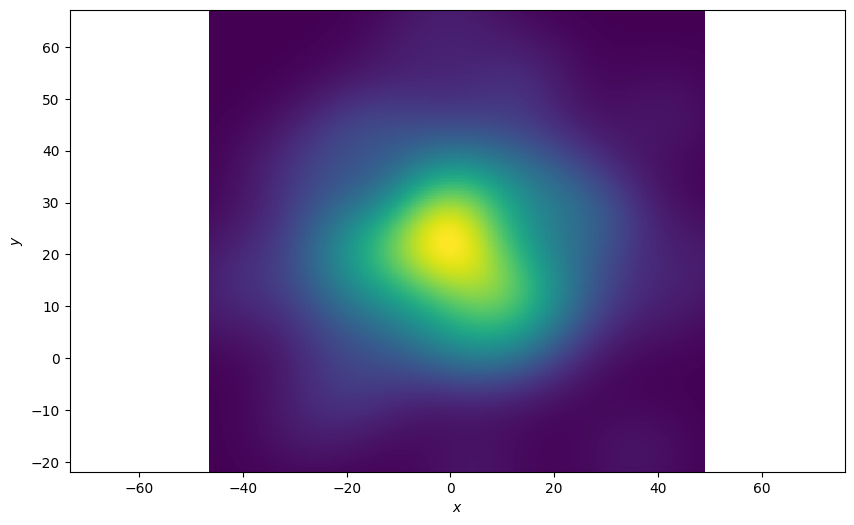
Plot of the Last State of the Ground Truths
The function allows you to pick an index of the state sequence (ground truth in this example) to plot. In this example we’re only interested in the final state of the sequences. An index of ‘-1’ is the last state in the sequence. The resultant plot is much more spread out.
plotter = Plotter()
plotter.plot_density(truths, index=-1)
Plot each state over time
Plot the density at each time-step and see how the density plot evolves. Define an animation update function.
def update(i):
    plotter.ax.clear()
    plotter.plot_density(truths, index=i)
    return plotter.ax
Finally, plot the densities over time.
plotter = Plotter()
animation.FuncAnimation(plotter.fig, update, frames=range(1, n_time_steps))
Total running time of the script: (0 minutes 22.290 seconds)