Note
Go to the end to download the full example code or to run this example in your browser via Binder
Density Plot Example
This example looks at how to plot 2d density plots. The Plotter().plot_density function can be
used to plot any number of StateMutableSequence objects. StateMutableSequences are just a
container for a number of states - examples include tracks and ground truth paths. The examples
below show how to plot ground truth paths (as they’re easy to generate). The function can be used to
analyse large data sets.
Set the imports and set the start time
from datetime import datetime, timedelta
from matplotlib import animation

from stonesoup.types.groundtruth import GroundTruthPath, GroundTruthState
from stonesoup.models.transition.linear import CombinedLinearGaussianTransitionModel, \
                                               ConstantVelocity
from stonesoup.plotter import Plotter

start_time = datetime.now()
Generate the State Sequences to Plot
In this example we will plot ground truth paths due to their ease of creation. The ground truths are created in the following function:
def generate_ground_truth_path(initial_state, num_steps=20, motion_model_noise=0.01):

    transition_model = CombinedLinearGaussianTransitionModel(
        [ConstantVelocity(motion_model_noise), ConstantVelocity(motion_model_noise)])

    ground_truth = GroundTruthPath([GroundTruthState(initial_state, timestamp=start_time)])

    for k in range(0, num_steps):
        ground_truth.append(GroundTruthState(
            transition_model.function(ground_truth[k], noise=True,
                                      time_interval=timedelta(seconds=1)),
            timestamp=start_time+timedelta(seconds=k+1)))

    return ground_truth
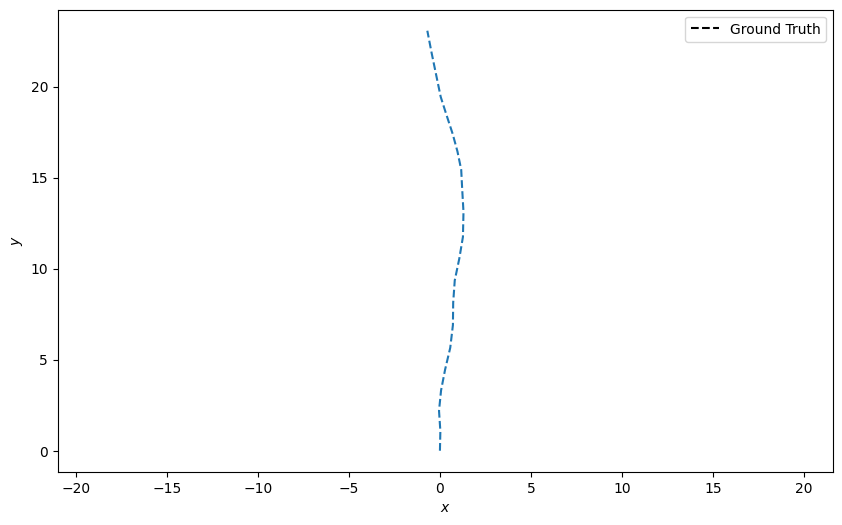
Create one ground truth path starting at the origin (0, 0) and plot it:
n_time_steps = 20
truth = generate_ground_truth_path(initial_state=[0, 0, 0, 1], num_steps=n_time_steps)

plotter = Plotter()
plotter.plot_ground_truths(truth, [0, 2])
[<matplotlib.lines.Line2D object at 0x7f54af5d9eb0>, <matplotlib.legend.Legend object at 0x7f54b5270fb0>]
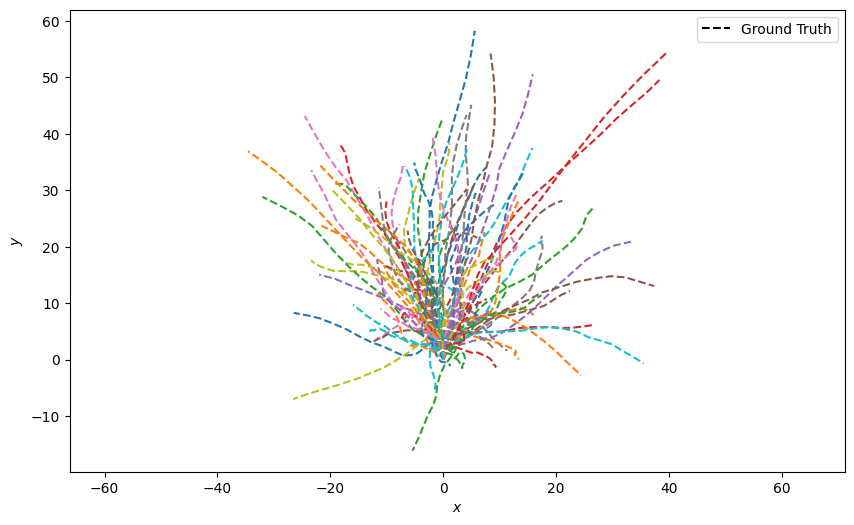
Generate 100 ground truth paths and plot them all at once. This looks quite messy:
truths = [generate_ground_truth_path(initial_state=[0, 0, 0, 1],
                                     num_steps=n_time_steps,
                                     motion_model_noise=0.1)
          for _ in range(100)]

plotter = Plotter()
plotter.plot_ground_truths(set(truths), [0, 2])
[<matplotlib.lines.Line2D object at 0x7f54ac963da0>, <matplotlib.lines.Line2D object at 0x7f54abaffad0>, <matplotlib.lines.Line2D object at 0x7f54abafc260>, <matplotlib.lines.Line2D object at 0x7f54abafc650>, <matplotlib.lines.Line2D object at 0x7f54abafc7d0>, <matplotlib.lines.Line2D object at 0x7f54abafce90>, <matplotlib.lines.Line2D object at 0x7f54abafd0a0>, <matplotlib.lines.Line2D object at 0x7f54abafd400>, <matplotlib.lines.Line2D object at 0x7f54abafdaf0>, <matplotlib.lines.Line2D object at 0x7f54abafdcd0>, <matplotlib.lines.Line2D object at 0x7f54abafe180>, <matplotlib.lines.Line2D object at 0x7f54abafe750>, <matplotlib.lines.Line2D object at 0x7f54abafe900>, <matplotlib.lines.Line2D object at 0x7f54abafef30>, <matplotlib.lines.Line2D object at 0x7f54abaffc20>, <matplotlib.lines.Line2D object at 0x7f54abafc860>, <matplotlib.lines.Line2D object at 0x7f54ab9e0650>, <matplotlib.lines.Line2D object at 0x7f54ab9e1460>, <matplotlib.lines.Line2D object at 0x7f54ab9e2510>, <matplotlib.lines.Line2D object at 0x7f54ab9e3770>, <matplotlib.lines.Line2D object at 0x7f54ab9e0a70>, <matplotlib.lines.Line2D object at 0x7f54ab9e03b0>, <matplotlib.lines.Line2D object at 0x7f54ab9e0500>, <matplotlib.lines.Line2D object at 0x7f54ab9e0ad0>, <matplotlib.lines.Line2D object at 0x7f54ab9e0cb0>, <matplotlib.lines.Line2D object at 0x7f54ab9e1010>, <matplotlib.lines.Line2D object at 0x7f54ab9e1550>, <matplotlib.lines.Line2D object at 0x7f54ab9e1730>, <matplotlib.lines.Line2D object at 0x7f54ab9e1b50>, <matplotlib.lines.Line2D object at 0x7f54ab9e1e50>, <matplotlib.lines.Line2D object at 0x7f54ab9e2450>, <matplotlib.lines.Line2D object at 0x7f54ab9e2900>, <matplotlib.lines.Line2D object at 0x7f54ab9e2a50>, <matplotlib.lines.Line2D object at 0x7f54ab9e2ff0>, <matplotlib.lines.Line2D object at 0x7f54ab9e31a0>, <matplotlib.lines.Line2D object at 0x7f54ab9e3710>, <matplotlib.lines.Line2D object at 0x7f54ab9e38c0>, <matplotlib.lines.Line2D object at 0x7f54ab9e3bf0>, <matplotlib.lines.Line2D object at 0x7f54ab9e2990>, <matplotlib.lines.Line2D object at 0x7f54afd0f830>, <matplotlib.lines.Line2D object at 0x7f54afd0d790>, <matplotlib.lines.Line2D object at 0x7f54afd0e240>, <matplotlib.lines.Line2D object at 0x7f54aeaffe90>, <matplotlib.lines.Line2D object at 0x7f54aeafd2e0>, <matplotlib.lines.Line2D object at 0x7f54aeafeed0>, <matplotlib.lines.Line2D object at 0x7f54aeafe390>, <matplotlib.lines.Line2D object at 0x7f54aeafc380>, <matplotlib.lines.Line2D object at 0x7f54aeafe870>, <matplotlib.lines.Line2D object at 0x7f54aeafca10>, <matplotlib.lines.Line2D object at 0x7f54aeafef00>, <matplotlib.lines.Line2D object at 0x7f54aeaff140>, <matplotlib.lines.Line2D object at 0x7f54aeafc050>, <matplotlib.lines.Line2D object at 0x7f54aeafc230>, <matplotlib.lines.Line2D object at 0x7f54aeafc6b0>, <matplotlib.lines.Line2D object at 0x7f54aeafe6f0>, <matplotlib.lines.Line2D object at 0x7f54aeafcfe0>, <matplotlib.lines.Line2D object at 0x7f54abe644a0>, <matplotlib.lines.Line2D object at 0x7f54aeb53b30>, <matplotlib.lines.Line2D object at 0x7f54aeb52e40>, <matplotlib.lines.Line2D object at 0x7f54aeb53530>, <matplotlib.lines.Line2D object at 0x7f54aeb53260>, <matplotlib.lines.Line2D object at 0x7f54aeb53890>, <matplotlib.lines.Line2D object at 0x7f54aeb530b0>, <matplotlib.lines.Line2D object at 0x7f54aeb50530>, <matplotlib.lines.Line2D object at 0x7f54ac6eeb70>, <matplotlib.lines.Line2D object at 0x7f54aba08a70>, <matplotlib.lines.Line2D object at 0x7f54aba0ade0>, <matplotlib.lines.Line2D object at 0x7f54abaebda0>, <matplotlib.lines.Line2D object at 0x7f54abae9070>, <matplotlib.lines.Line2D object at 0x7f54abaea240>, <matplotlib.lines.Line2D object at 0x7f54abaeb3e0>, <matplotlib.lines.Line2D object at 0x7f54abaeb260>, <matplotlib.lines.Line2D object at 0x7f54abaea000>, <matplotlib.lines.Line2D object at 0x7f54abaeaf90>, <matplotlib.lines.Line2D object at 0x7f54abae8230>, <matplotlib.lines.Line2D object at 0x7f54abae8560>, <matplotlib.lines.Line2D object at 0x7f54abae8d40>, <matplotlib.lines.Line2D object at 0x7f54abae8e90>, <matplotlib.lines.Line2D object at 0x7f54abae9280>, <matplotlib.lines.Line2D object at 0x7f54abae9730>, <matplotlib.lines.Line2D object at 0x7f54abae9d00>, <matplotlib.lines.Line2D object at 0x7f54abaea1b0>, <matplotlib.lines.Line2D object at 0x7f54abaea390>, <matplotlib.lines.Line2D object at 0x7f54abaea8d0>, <matplotlib.lines.Line2D object at 0x7f54abaea990>, <matplotlib.lines.Line2D object at 0x7f54abaeae10>, <matplotlib.lines.Line2D object at 0x7f54abaeb350>, <matplotlib.lines.Line2D object at 0x7f54abaeb500>, <matplotlib.lines.Line2D object at 0x7f54abaebad0>, <matplotlib.lines.Line2D object at 0x7f54abaebc20>, <matplotlib.lines.Line2D object at 0x7f54abae8920>, <matplotlib.lines.Line2D object at 0x7f54b3be0ce0>, <matplotlib.lines.Line2D object at 0x7f54b3be0110>, <matplotlib.lines.Line2D object at 0x7f54b3be0ef0>, <matplotlib.lines.Line2D object at 0x7f54b3be14c0>, <matplotlib.lines.Line2D object at 0x7f54b3be0b60>, <matplotlib.lines.Line2D object at 0x7f54b0c6fef0>, <matplotlib.lines.Line2D object at 0x7f54b0c6cb00>, <matplotlib.lines.Line2D object at 0x7f54b0c6d2e0>, <matplotlib.lines.Line2D object at 0x7f54af44cf50>, <matplotlib.legend.Legend object at 0x7f54abacb2c0>]
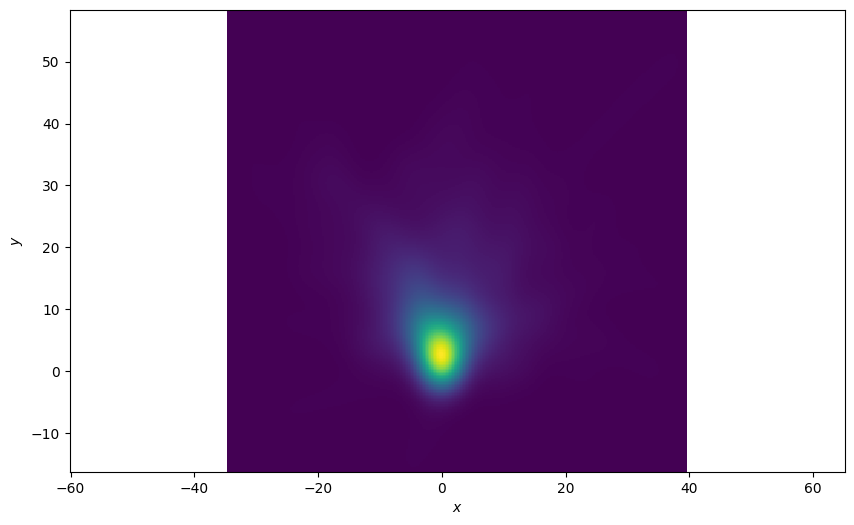
Density Plot of All States
Plot a 2D density plot for all the states in the ground truths. This is a better visualisation because we can see a clear concentration of states around the origin where all the tracks start.
plotter = Plotter()
plotter.plot_density(truths, index=None)
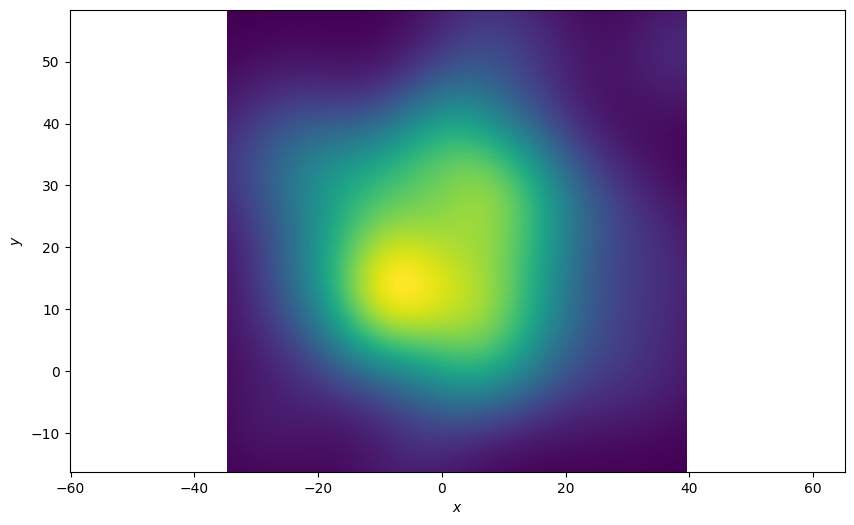
Plot of the Last State of the Ground Truths
The function allows you to pick an index of the state sequence (ground truth in this example) to plot. In this example we’re only interested in the final state of the sequences. An index of ‘-1’ is the last state in the sequence. The resultant plot is much more spread out.
plotter = Plotter()
plotter.plot_density(truths, index=-1)
Plot each state over time
Plot the density at each time-step and see how the density plot evolves. Define an animation update function.
def update(i):
    plotter.ax.clear()
    plotter.plot_density(truths, index=i)
    return plotter.ax
Finally, plot the densities over time.
plotter = Plotter()
animation.FuncAnimation(plotter.fig, update, frames=range(1, n_time_steps))
Total running time of the script: (0 minutes 21.192 seconds)